
 chinahuijue@gmail.com
 +1 (702) 204-9855
Why Developing Countries Need Solar Energy: Electrification & Economic Growth 2026
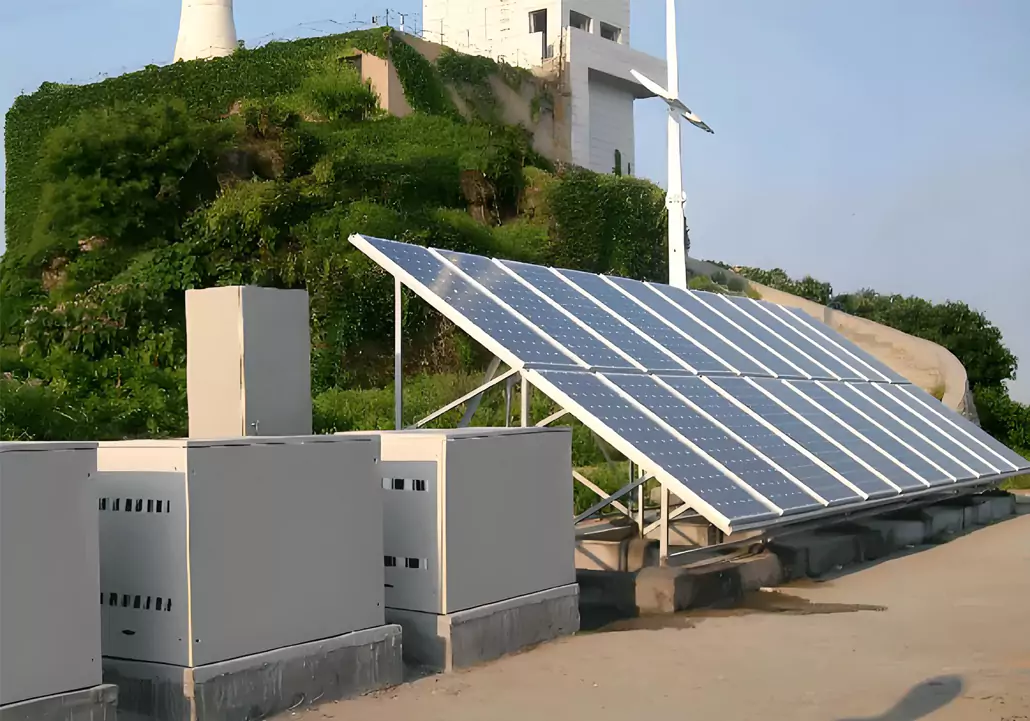
Over 733 million people worldwide still lack access to electricity — and 75% of them live in Sub-Saharan Africa and South Asia. For these communities, extending the national grid is often prohibitively expensive at $2,000-$5,000 per kilometer. Solar energy offers the fastest, most cost-effective path to universal electrification, and its decentralized nature makes it ideal for the remote rural communities that grid extension cannot economically reach. For those planning specific system configurations, our 4-step off-grid solar system sizing guide provides the calculation formulas needed.
⚡ Quick Answer: Solar vs Traditional Energy in Developing Countries
| Metric | Solar Home System | Kerosene Lamp | Diesel Generator | Grid Extension |
|---|---|---|---|---|
| Cost per kWh (effective) | $0.05 – $0.15 | $5.00 – $8.00 | $0.30 – $0.60 | $0.10 – $0.25* |
| Upfront Cost | $200 – $500 | $5 – $10 | $500 – $2,000 | $2,000 – $5,000/km |
| CO₂ Emissions | 0 kg/kWh | 2.5 kg/liter | 2.7 kg/liter | Grid-dependent |
| Health Impact | ✅ Zero pollution | 🔴 Indoor air pollution | 🟡 Noise + fumes | ✅ Clean |
| Time to Deploy | 1-2 days | Immediate | 1-2 days | 1-5 years |
| Maintenance | Minimal (clean panels) | Fuel purchase | Frequent servicing | Utility-managed |
*Grid extension cost includes infrastructure; per-kWh rate only where grid already exists.
1. The Electrification Gap: Where Do 733 Million People Live?
The global electrification gap is concentrated in specific regions. The table below shows where the un-electrified population lives and the solar potential available:
| Region | People Without Electricity | % of Population | Solar Resource (kWh/kWp/yr) | Grid Extension Cost ($/km) |
|---|---|---|---|---|
| Sub-Saharan Africa | 600M | 51% | 1,600 – 2,000 | $3,000 – $8,000 |
| South Asia (India, Pakistan, Bangladesh) | 80M | 5% | 1,400 – 1,800 | $2,000 – $5,000 |
| Southeast Asia (Indonesia, Philippines) | 35M | 8% | 1,300 – 1,700 | $2,500 – $6,000 |
| Latin America | 17M | 3% | 1,500 – 1,900 | $3,000 – $7,000 |
| Middle East & North Africa | 1M | <1% | 1,700 – 2,100 | $4,000 – $10,000 |
The contrast is striking: Sub-Saharan Africa has the world’s best solar resource but the lowest electrification rate. Solar is not just an option — it’s the most logical solution.
2. Why Solar Is the Best Solution for Developing Countries
| Factor | Why Solar Wins | Quantified Advantage |
|---|---|---|
| Geography | Tropical/Equatorial locations have 4-6 peak sun hours/day year-round | 1,600-2,000 kWh/kWp/yr vs. Germany’s 1,100 |
| Infrastructure | No transmission lines needed; deploy at point of consumption | Saves $2,000-$8,000/km vs. grid extension |
| Cost | LCOE 80-90% lower than kerosene; 50-70% lower than diesel | $0.05-0.15/kWh vs. $0.30-0.60 diesel |
| Speed | SHS installed in hours; microgrid in days | 1-2 days vs. 1-5 years for grid |
| Scalability | Modular — start small, expand as budget allows | Add panels/batteries incrementally |
| Environment | Zero emissions; replaces polluting kerosene/diesel | 1 SHS saves ~500 kg CO₂/year |
| Health | Eliminates indoor air pollution from kerosene | 4M premature deaths/year from indoor smoke |
3. Solar Project Models in Developing Countries
Solar deployment in developing countries follows four primary models, each suited to different community sizes and needs:
| Model | Scale | Typical Cost | Serves | Best For |
|---|---|---|---|---|
| Solar Home System (SHS) | 10-200W panel + battery | $50 – $500 | 1 household | Lighting, phone charging, small TV |
| Community Microgrid | 5-100kW + battery | $30,000 – $150,000 | 50-500 households | Villages, schools, clinics, small businesses |
| Productive Use Solar | 1-10kW systems | $3,000 – $20,000 | Farms, workshops | Water pumps, grain mills, cold storage |
| Utility-Scale Solar | 1-100MW | $1M – $60M | Grid-connected regions | National grid supply, urban areas |
4. Economic Benefits: Quantified Impact
| Benefit | Before Solar | After Solar | Annual Savings / Gain |
|---|---|---|---|
| Energy Cost (per household) | $120-300/yr (kerosene + batteries + charging) | $0-30/yr (minimal maintenance) | Save $100-270/yr |
| Health | Indoor air pollution; respiratory disease | Clean lighting; reduced medical costs | Save $50-150/yr in medical expenses |
| Education | No evening study; limited school hours | 3-4 extra study hours/day | +15-20% academic performance |
| Productive Hours | Daylight only (6-8 hours) | Extended to 10-14 hours | +40-60% productive time |
| Income Generation | Limited to manual labor | Solar-powered businesses (sewing, milling, cold storage) | +20-50% household income |
| Jobs Created | N/A | Installation, maintenance, sales per 1,000 SHS | 15-30 local jobs per 10,000 systems |
| Communication | Phone charging costs $0.10-0.25/charge | Free home charging | Save $30-60/yr per household |
5. Financing Models That Make Solar Affordable
The biggest barrier to solar adoption in developing countries is upfront cost. Four innovative financing models have solved this:
| Model | How It Works | Household Cost | Examples | Scale |
|---|---|---|---|---|
| PAYG (Pay-As-You-Go) | Daily/weekly mobile money payments for 1-3 years, then ownership | $0.30-$0.50/day | M-KOPA (Kenya), d.light, Fenix | 15M+ systems in Africa |
| Microfinance Loans | Small loans from MFIs to purchase SHS, repaid over 12-36 months | $15-$40/month | IDCOL (Bangladesh), Grameen Shakti | 4M+ systems in Bangladesh |
| Government Subsidies | Direct grants or co-financing for rural electrification programs | 30-80% cost covered | India Saubhagya, Nigeria Solar Power Naija | 28M+ connections (India) |
| Community Ownership | Village cooperative jointly owns microgrid; members pay per-kWh tariff | $0.25-$0.50/kWh | Tanzania JUMEME, Nigeria Husk Power | 1,000+ microgrids |
6. Country Case Studies: What’s Working
| Country | Program | Households Reached | Key Innovation | Economic Impact |
|---|---|---|---|---|
| 🇰🇪 Kenya | M-KOPA / Off-grid solar | 1.5M+ SHS | PAYG via M-Pesa mobile money | $400M+ saved on kerosene; 10,000+ jobs created |
| 🇧🇩 Bangladesh | IDCOL Solar Home Systems | 4.0M+ SHS | Microfinance + NGO partnerships | 20M+ people electrified; 70,000+ jobs |
| 🇮🇳 India | Saubhagya Scheme | 28M+ connections | Government-funded grid + solar microgrids | 99.9% village electrification rate |
| 🇷🇼 Rwanda | Off-Grid Strategy | 500K+ SHS | Results-based financing for private sector | 48% off-grid target met by 2024 |
| 🇳🇬 Nigeria | Solar Power Naija | 5M target by 2025 | Concession financing + mini-grids | $550M program; 25M people targeted |
| 🇪🇹 Ethiopia | National Electrification Plan | 3.6M SHS target | Public-private SHS distribution | 65% of new connections via off-grid |
| 🇵🇰 Pakistan | Solarization of Agriculture | 20,000+ tube wells | Solar water pumps replacing diesel | $200M+ saved on diesel annually |
| 🇵🇭 Philippines | Barangay Solar Microgrids | 1,000+ villages | Island microgrids for remote barangays | First-time electricity for 2M+ people |
📍 Kenya — M-KOPA Solar: The PAYG Pioneer
M-KOPA combined solar SHS with M-Pesa mobile payments, allowing households to pay $0.45/day for 12-18 months. After payment completion, the system is theirs. Results: 1.5M+ systems deployed, $400M+ saved on kerosene, 10,000+ direct jobs, and 19% of Kenya’s rural population now has solar electricity. The model has been replicated in Uganda, Nigeria, and Ghana.
📍 Bangladesh — IDCOL: World’s Largest Off-Grid Solar Program
Through 47+ partner organizations and microfinance loans, Bangladesh installed 4M+ SHS serving 20M+ people. Households repay $10-15/month over 3 years. The program created 70,000+ jobs in installation, maintenance, and sales. Kerosene consumption dropped by 80% in covered areas.
📍 Pakistan — Solar Water Pumps for Agriculture
Pakistan’s agricultural sector relies heavily on diesel-powered tube wells. Converting 20,000+ to solar saved $200M+ annually in diesel costs while increasing pumping reliability. Farmers report 30-50% income increases from extended irrigation hours. This model is now expanding to Sudan, Egypt, and Kenya.
7. Challenges & Solutions
| Challenge | Impact | Solution | Status |
|---|---|---|---|
| Upfront Cost | $200-500 SHS = 2-6 months income for rural households | PAYG, microfinance, subsidies | ✅ Scaling rapidly (15M+ PAYG) |
| Technical Skills Gap | Few trained installers in remote areas | Vocational training programs (Tanzania, Kenya) | 🟡 Growing but insufficient |
| Quality Control | Substandard products erode consumer trust | Lighting Global quality certification | ✅ 60+ brands certified |
| Supply Chain | Last-mile distribution to remote villages | Local entrepreneur networks + agent models | 🟡 Improving |
| Policy/Regulation | Import tariffs on solar components in some countries | VAT exemptions (Kenya, Rwanda, Nigeria) | 🟡 30+ countries have exemptions |
| E-Waste | Battery/panel disposal at end-of-life | Recycling programs (emerging) | 🔴 Early stage |
As we analyzed in our deep dive on solar energy storage and intermittency solutions, battery cost reduction is the single most important factor enabling 24/7 solar power in off-grid communities. LFP battery prices have dropped from $1,100/kWh in 2010 to $130/kWh in 2025, making multi-day energy storage economically viable for the first time.
8. The Road Ahead: 2030 Outlook
| Metric | 2025 Status | 2030 Target | Trend |
|---|---|---|---|
| Global un-electrified population | 733M | <300M (SDG 7) | ↓ 8-10%/yr |
| SHS deployed in Africa | 15M | 50M+ | ↑ 25-30%/yr |
| Solar microgrids globally | 5,000+ | 20,000+ | ↑ 30%/yr |
| LFP battery cost ($/kWh) | $130 | $80-100 | ↓ 8-10%/yr |
| PAYG customers | 15M | 50M+ | ↑ 25%/yr |
| Solar jobs in developing countries | 3.5M | 8M+ | ↑ 18%/yr |
Powering Communities With Solar
From solar home systems to community microgrids, we provide end-to-end solar solutions for developing markets. Get a free consultation on system design, financing options, and deployment strategy.