
 chinahuijue@gmail.com
 +1 (702) 204-9855
Centralized Photovoltaic Project Development: Process, Challenges & Solutions 2026
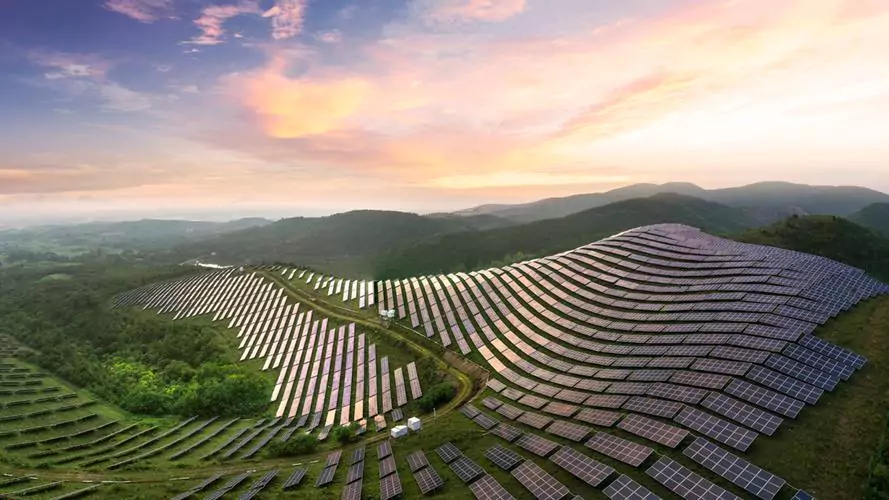
Driven by the global “dual carbon” goal, centralized photovoltaic (PV) projects have emerged as a critical growth engine in the renewable energy sector. In 2025 alone, newly installed centralized PV capacity exceeded 280 GW worldwide, representing over 60% of all new solar deployments. However, the very scale that delivers economies of advantage also introduces formidable complexity across site selection, land acquisition, construction, and grid connection. This guide breaks down the full development lifecycle, quantifies the challenges, and examines real-world case studies to help developers navigate this demanding landscape.
For a broader understanding of large-scale solar infrastructure, see our companion guide on Containerized Solar Power Systems.
Quick Answer: Centralized PV Development at a Glance
| Stage | Duration | Key Challenge | Cost Share |
|---|---|---|---|
| Site Selection & Feasibility | 3–6 months | Compliant land scarcity | 2–4% |
| Land Acquisition & Permitting | 6–18 months | Approval delays, policy shifts | 10–20% |
| Equipment Procurement | 3–6 months | Price volatility, quality control | 45–55% |
| Construction & Installation | 6–12 months | Terrain, weather, logistics | 15–25% |
| Grid Connection & Commissioning | 2–6 months | Absorption capacity, red zones | 5–10% |
| O&M (Annual) | Ongoing | Performance degradation | 1–2% of CapEx/yr |
1. Global Centralized PV Market Overview
Centralized PV projects—utility-scale solar farms typically rated 10 MW and above—account for the lion’s share of global solar capacity additions. Their scale enables lower per-watt costs through bulk procurement, standardized engineering, and centralized O&M. However, this same scale multiplies every challenge: land requirements measured in thousands of acres, transmission infrastructure demands, and regulatory complexity across multiple jurisdictions.
| Region | 2025 New Centralized PV (GW) | Share of Total Solar | Growth vs 2024 | Key Driver |
|---|---|---|---|---|
| China | 120.5 | 58% | +22% | Desert/gobi mega-bases |
| Europe (EU-27) | 42.8 | 51% | +15% | REPowerEU targets |
| United States | 38.6 | 67% | +18% | IRA tax credits |
| India | 25.3 | 72% | +31% | National Solar Mission |
| Middle East & Africa | 18.7 | 79% | +44% | Low LCOE, oil diversification |
| Southeast Asia | 12.1 | 64% | +27% | Feed-in tariffs, PPAs |
| Global Total | 258.0 | 61% | +23% | — |
Notably, the Middle East and Africa show the highest growth rate (+44%) and the highest share of centralized PV (79%), driven by exceptional solar resources and the strategic shift from oil-dependent economies.
2. The Development & Construction Process
A centralized PV project moves through five distinct phases. Each phase carries its own technical, regulatory, and financial risks that can derail timelines and budgets if not managed proactively.
2.1 Phase Timeline Overview
| Phase | Key Activities | Typical Duration | Key Deliverables | Risk Level |
|---|---|---|---|---|
| Phase 1: Preliminary Investigation | Resource assessment, drone surveys, environmental screening | 3–6 months | Feasibility study, site report | Medium |
| Phase 2: Land & Permitting | Land lease negotiation, EIA filing, grid access agreement | 6–18 months | Land use rights, construction permit | High |
| Phase 3: Procurement | Module/inverter/structure bidding, BoS sourcing | 3–6 months | Supply contracts, delivery schedule | Medium |
| Phase 4: Construction | Civil works, mounting, module installation, cabling | 6–12 months | Commissioned plant, test reports | High |
| Phase 5: Grid Connection | Booster station, transmission line, grid compliance testing | 2–6 months | Grid connection approval, COD | High |
Total typical timeline: 20–48 months from initial site visit to commercial operation date (COD), with high-altitude or ecologically sensitive projects requiring additional time.
2.2 Preliminary Investigation & Site Selection
Site selection is the make-or-break first step. Developers must evaluate solar irradiance, topography, land use classification, grid access distance, and environmental constraints simultaneously. Modern tools include drone aerial surveys, geological core drilling, and GIS-based suitability modeling.
| Evaluation Criteria | Minimum Threshold | Preferred Range | Assessment Method | Weight |
|---|---|---|---|---|
| Global Horizontal Irradiance (GHI) | ≥4.5 kWh/m²/day | 5.5–6.5 kWh/m²/day | Satellite data + on-site pyranometer | 30% |
| Land Gradient | ≤25° | ≤10° | Topographic survey, DEM analysis | 15% |
| Available Area | ≥3 ha/MW | 2.5–3.5 ha/MW | Cadastral mapping | 10% |
| Grid Connection Distance | ≤30 km | ≤10 km | Grid topology review | 20% |
| Land Use Classification | Non-agricultural or compatible | Unused/gobi/desert | Land bureau verification | 15% |
| Environmental Sensitivity | No protected zone overlap | Low biodiversity impact | EIA screening | 10% |
Case Spotlight: Sichuan 500MW High-Altitude PV Project
A 500 MW photovoltaic station in western Sichuan sits on a plateau above 4,000 meters elevation. The project faced dual challenges: complex mountainous terrain and the need to coexist with traditional herder grazing activities. The solution—raising panel mounting brackets to ≥1.8 meters—enabled sheep to graze beneath the arrays, achieving a harmonious “photovoltaic + animal husbandry” model that increased land-use efficiency by 40% compared to single-use designs.
| Parameter | Value |
|---|---|
| Installed Capacity | 500 MW |
| Elevation | 4,000–4,300 m |
| Land Area | ~1,500 ha |
| Bracket Height | ≥1.8 m (for grazing) |
| Annual Generation | ~800 GWh |
| Grazing Compatibility | Yes (sheep) |
2.3 Land Acquisition & Formalities Handling
Centralized PV projects require large-scale land, making acquisition and permitting one of the most time-consuming and uncertain phases. Developers must negotiate with landowners, complete Environmental Impact Assessments (EIAs), obtain construction permits, and secure grid access agreements—all while navigating shifting local policies.
| Approval Item | Responsible Authority | Typical Duration | Common Bottleneck | Cost Impact |
|---|---|---|---|---|
| Land Use Rights | Natural Resources Bureau | 3–9 months | Land classification disputes | $0.03–0.08/W |
| Environmental Impact Assessment | Ecology & Environment Bureau | 3–6 months | Protected species surveys | $0.005–0.015/W |
| Water & Soil Conservation | Water Resources Bureau | 2–4 months | Runoff management plans | $0.003–0.008/W |
| Grid Access Agreement | Grid Company (State/Local) | 3–12 months | Transmission capacity review | $0.02–0.06/W |
| Construction Permit | Local Housing & Urban-Rural Dev. | 2–4 months | Zoning compliance | $0.002–0.005/W |
| Project Filing/Approval | Development & Reform Commission | 1–3 months | Quota availability | Minimal direct cost |
Delays in any single approval can cascade—grid access agreements contingent on EIA completion, construction permits contingent on land rights, and so on. Experienced developers maintain parallel processing tracks and pre-build relationships with local authorities.
2.4 Construction Implementation & Engineering Management
The construction phase transforms plans into a functioning power plant. Civil works, equipment installation, and commissioning must be tightly coordinated. Technical decisions on equipment selection and structural design directly determine 20+ years of operational performance.
| Equipment Category | Key Specification | Selection Criteria | Impact on LCOE |
|---|---|---|---|
| PV Modules | ≥580W bifacial double-glass | Efficiency ≥22%, 30-year warranty | −15 to −20% |
| Inverters | ≥350kW string type | Efficiency ≥99%, MPPT channels ≥12 | −5 to −8% |
| Mounting Structure | Hot-dip galvanized steel | Wind load ≥42 m/s, seismic ≤8 magnitude | −2 to −5% |
| Cables (DC) | PV1-F 1500V rated | UV resistant, 25-year service life | −1 to −3% |
| Transformer | 35kV/220kV step-up | Loss ≤0.5%, ONAN/ONAF cooling | −3 to −5% |
| Tracking System (optional) | Single-axis horizontal | Gain +8–12% yield, payback 3–5 yr | −5 to −10% (with gain) |
For projects integrating energy storage—as increasingly required by grid operators—our 5MWh BESS Container Cost Guide provides detailed pricing and specification data for utility-scale storage deployment.
2.5 Grid Connection & Operation
Grid absorption capacity remains the single most critical constraint for centralized PV project viability. Insufficient local grid capacity, combined with PV’s intermittent generation profile, creates absorption bottlenecks. Some regions are officially designated “red warning areas” where new grid connections are restricted.
| Grid Connection Challenge | Description | Mitigation Strategy | Implementation Cost |
|---|---|---|---|
| Insufficient Transmission Capacity | Local grid below PV peak output | Build dedicated transmission lines | $0.05–0.12/W |
| Curtailment (Abandoned PV) | Grid cannot absorb all generation | Deploy energy storage for peak shaving | $0.08–0.15/W |
| Power Quality Issues | Voltage fluctuation, harmonics | STATCOM/SVG reactive compensation | $0.01–0.03/W |
| Red Warning Zone Designation | New connections restricted | Relocate or await capacity upgrade | Opportunity cost: high |
| Frequency Stability | Inverter-based generation lacks inertia | Grid-forming inverters + storage | $0.02–0.05/W |
| Interconnection Queue Delays | Backlog of projects awaiting study | Early grid consultation, fast-track agreements | Time cost: 6–18 months |
The integrated “source-grid-load-storage” approach—co-locating generation, grid infrastructure, demand-side loads, and energy storage—is increasingly mandated by grid operators to ensure stable integration of large-scale PV capacity.
3. Key Development Difficulties
3.1 Land Use Scarcity
Finding compliant land is the first and often most difficult hurdle. The scarcity of suitable, legally developable land has become the primary factor constraining centralized PV growth, especially in economically developed regions with high energy demand.
| Land Challenge | Impact | Most Affected Regions | Mitigation Approach |
|---|---|---|---|
| Arable land protection policies | Eliminates flat, accessible land | China (central/eastern), Europe | Use marginal/degraded land |
| Ecological red lines | Excludes protected areas | Global | Pre-screening with GIS |
| Competing land uses | Rising land prices | India, Southeast Asia | Agri-PV hybrid models |
| Excessive quota issuance | More projects than available land | China, India | Conservative project pipeline |
| Community opposition | Permitting delays or rejection | Europe, United States | Early community engagement |
3.2 Rising Non-Technical Costs
While PV module prices have fallen dramatically (down 49% in 2024 alone), non-technical costs have risen to consume much of the savings. Local governments facing fiscal pressure increasingly demand industrial matching investments, resource compensation fees, and other conditions in exchange for project approval.
| Non-Technical Cost Category | Share of Total Project Cost | Trend (2023→2026) | Key Driver |
|---|---|---|---|
| Land lease & compensation | 10–20% | ↑ Rising | Land scarcity, competition |
| Grid access & connection fees | 5–10% | ↑ Rising | Grid upgrade requirements |
| Industrial matching (local gov.) | 10–20% | ↑↑ Sharply rising | Fiscal pressure, local development |
| Administrative & approval fees | 2–5% | → Stable | Regulatory process |
| Intermediary & consulting | 3–8% | ↑ Rising | Complexity of approvals |
| Financing & insurance | 5–8% | ↓ Falling | Lower interest rates |
| Total Non-Technical | 25–40% | ↑ Rising | — |
In some regions, non-technical costs now account for up to 40% of total project investment—effectively offsetting the entire cost reduction achieved through module price declines. This trend severely compresses developer profit margins and underscores the importance of thorough cost modeling during the feasibility stage.
4. Case Studies: Real-World Centralized PV Projects
Case 1: Sichuan Maerkang High-Altitude PV Project
| Parameter | Value | Notes |
|---|---|---|
| Location | Dazang Township, Maerkang City, Aba Prefecture | Remote highland region |
| Elevation | 3,500–4,300 m | Extreme cold, UV exposure |
| Total Land Area | 7,607 mu (~507 ha) | Alpine grassland |
| Installed Capacity | 400 MW (400,000 kW) | Phase 1 |
| Total Investment | ¥2.198 billion (~$305M) | $0.76/W |
| Module Technology | Bifacial double-glass, fixed tilt | High UV resistance |
| Booster Stations | 2 × 220kV | Redundant transmission |
| Transmission Lines | 52.7 km | Mountainous route |
| Annual Net Cash Flow | ¥164.9 million (~$22.9M) | Payback ~9.6 years |
| Revenue Streams | Power generation + carbon credits + ecological compensation | Diversified income |
Key takeaway: Extreme climate was addressed through specialized cold-resistant components, UV-stable encapsulants, and redundant transmission. Ecological compensation measures ensured regulatory approval while maintaining project economics.
Case 2: 50MW PV + 15MW Battery Storage Combined Station
| Parameter | Value | Notes |
|---|---|---|
| PV Capacity | 50 MW | Centralized PV array |
| Storage Capacity | 15 MW / 30 MWh | 30% PV capacity ratio |
| Storage Technology | LFP battery (LiFePO₄) | 10-year cycle life |
| Operating Mode | Peak shaving + curtailment reduction | EMS-optimized dispatch |
| Curtailment Reduction | ~8.3% → ~2.1% | 6.2 percentage points |
| Power Quality Improvement | THD reduced by 35% | Active filtering via inverter |
| Storage CapEx | ~$9.5M | $317/kWh |
| Annual Storage Revenue | ~$2.8M | Arbitrage + curtailment savings |
| Storage Payback | ~5.2 years | Within warranty period |
Key takeaway: The 30% PV-to-storage capacity ratio proved optimal for this grid conditions. Curtailment dropped from 8.3% to 2.1%, recovering approximately 3.1 GWh of otherwise abandoned generation annually—worth roughly $310,000 in additional revenue.
Case 3: Yumen Oilfield 200MW Photovoltaic Project
| Parameter | Value | Notes |
|---|---|---|
| Developer | PetroChina (CNPC) | First centralized PV for oil major |
| Location | Yumen, Gansu Province | Gobi desert, ideal irradiance |
| Installed Capacity | 200 MW | Single phase |
| Cumulative Generation | >1 billion kWh | Since COD |
| Operation Model | Unmanned, intelligent O&M | Big data + remote monitoring |
| Grid Connection | Green electricity access channel | Expedited interconnection |
| CO₂ Offset | ~820,000 tons/year | Equivalent to 35M trees |
| Annual Revenue | ~$18M | At ~$0.054/kWh tariff |
Key takeaway: As the first centralized PV project by a major oil company, Yumen demonstrates the viability of brownfield-to-greenfield energy transitions. Unmanned operation through intelligent O&M reduced annual OPEX by approximately 60% compared to traditional staffed operations.
5. Comparative Analysis: Three Development Models
| Factor | Pure PV (No Storage) | PV + Battery Storage | PV + Storage + Grid Services |
|---|---|---|---|
| Initial CapEx ($/W) | $0.55–0.70 | $0.65–0.85 | $0.70–0.95 |
| Curtailment Rate | 5–15% | 1–3% | <1% |
| Revenue Streams | Energy only | Energy + arbitrage | Energy + arbitrage + ancillary services |
| Grid Connection Difficulty | High | Medium | Low (preferred by grid) |
| Project IRR | 6–9% | 7–10% | 8–12% |
| Payback Period | 8–12 years | 6–9 years | 5–8 years |
| Regulatory Compliance | Increasingly restricted | Mandated in many regions | Incentivized |
| Land Use Efficiency | Baseline | +5% (shared land) | +8% (optimized layout) |
The data clearly shows that while adding storage increases initial investment by 15–25%, the combination of reduced curtailment, additional revenue streams, and easier grid approval typically improves overall project IRR by 1–3 percentage points.
6. Non-Technical Cost Breakdown & Optimization
| Cost Item | Typical ($/W) | Optimization Strategy | Potential Savings |
|---|---|---|---|
| Land lease (20-yr) | $0.03–0.08 | Negotiate long-term fixed rate; use degraded land | 20–30% |
| Industrial matching | $0.05–0.12 | Phase commitments; local manufacturing JV | 30–50% |
| Grid connection fees | $0.02–0.06 | Early grid consultation; shared transmission | 15–25% |
| Approval & permitting | $0.01–0.03 | Experienced local consulting team | 20–35% |
| Intermediary fees | $0.02–0.05 | Direct government engagement; reduce layers | 40–60% |
| Insurance & financing | $0.03–0.06 | Green bonds; multilateral guarantees | 15–25% |
| Total Non-Technical | $0.16–0.40 | Integrated optimization | 20–35% overall |
7. Equipment Cost Trends (2024–2026)
| Equipment | 2024 Price ($/W or $/kWh) | 2025 Price | 2026 Forecast | 3-Year Trend |
|---|---|---|---|---|
| PV Modules (mono PERC) | $0.15/W | $0.10/W | $0.08–0.09/W | ↓ 40–47% |
| PV Modules (TOPCon) | $0.18/W | $0.12/W | $0.09–0.10/W | ↓ 44–50% |
| Inverters (string) | $0.04/W | $0.03/W | $0.025–0.03/W | ↓ 25–37% |
| Mounting (fixed) | $0.05/W | $0.045/W | $0.04–0.045/W | ↓ 10–20% |
| Mounting (tracker) | $0.10/W | $0.085/W | $0.08–0.085/W | ↓ 15–20% |
| BESS (LFP, 2hr) | $280/kWh | $220/kWh | $180–200/kWh | ↓ 29–36% |
| BOS & Installation | $0.18/W | $0.16/W | $0.15–0.16/W | ↓ 11–17% |
Module costs have nearly halved in three years, but as shown in Section 3.2, non-technical costs have risen to consume these savings. The net effect: total project cost has decreased only 10–15% despite the dramatic module price decline.
8. How Difficult Is Centralized PV Development?
After reviewing the full lifecycle—from preliminary site investigation through grid connection and ongoing operation—the answer is clear: the difficulty is substantial, but manageable with proper preparation.
| Difficulty Dimension | Difficulty Score (1-10) | Primary Risk | Key Success Factor |
|---|---|---|---|
| Site Selection | 7/10 | Compliant land scarcity | GIS pre-screening + local partnerships |
| Land & Permitting | 9/10 | Approval delays, policy shifts | Early government engagement |
| Procurement | 5/10 | Price volatility, quality | Framework agreements, QA inspection |
| Construction | 7/10 | Weather, terrain, logistics | Experienced EPC, contingency plans |
| Grid Connection | 8/10 | Absorption capacity, curtailment | Storage integration, grid consultation |
| O&M | 4/10 | Performance degradation | Intelligent monitoring, preventative maintenance |
| Overall | 7/10 | Regulatory + grid | Integrated project management |
Centralized PV projects remain a vital growth direction for the future energy landscape, offering unmatched scale effects and sustainability advantages. For organizations considering PV development, in-depth understanding of the entire construction process and thorough preparation—particularly in land, permitting, and grid integration—are the keys to success.
Huijue Group: Powering Your Centralized PV+Storage Projects
Whether you’re developing a 50 MW pilot or a 500 MW mega-base, Huijue Group provides integrated energy storage solutions engineered for utility-scale PV projects. Our modular LFP battery cabinets (50kWh–261kWh per unit), intelligent BMS/EMS platforms, and containerized BESS systems support parallel deployment for projects of any size.
With proven deployments across Africa, the Middle East, and Southeast Asia, we help developers overcome grid connection challenges, reduce curtailment, and maximize project IRR.
Contact Huijue Group today to discuss your centralized PV+storage project requirements.
Frequently Asked Questions
Q1: What is a centralized photovoltaic project?
A centralized PV project is a large-scale solar power plant (typically ≥10MW) that generates electricity from concentrated arrays of solar panels and feeds it into the regional or national grid, as opposed to distributed rooftop systems. Centralized projects require extensive land, grid infrastructure, and complex multi-stage development.
Q2: How long does it take to develop a centralized PV project from start to grid connection?
The full development cycle typically takes 12 to 36 months. Site selection and feasibility studies take 3-6 months, land acquisition and permitting 6-18 months, construction 6-12 months, and grid connection commissioning 2-6 months. High-altitude or environmentally sensitive projects may take longer.
Q3: What are the main non-technical costs in centralized PV development?
Non-technical costs include land lease and compensation (10-20% of total cost), grid access fees (5-10%), administrative approval and permitting fees (2-5%), industrial matching investments required by local governments (10-20%), and intermediary/consulting fees (3-8%). These can account for 25-40% of total project cost.
Q4: Why is grid connection difficult for centralized PV projects?
Grid absorption capacity is the core constraint. Many regions lack sufficient transmission infrastructure or have grid capacity below PV output peaks. Some areas are designated “red warning zones” with limited new grid connection quota. Energy storage integration and advance coordination with grid companies are essential solutions.
Q5: How much does energy storage add to a centralized PV project cost?
Adding 15-20% capacity energy storage to a centralized PV project typically increases total investment by 8-15%. For a 500MW PV project, a 100MW/200MWh storage system adds approximately USD 35-50 million. However, storage enables peak shaving, reduces curtailment, and improves grid stability, often achieving ROI within 5-7 years.
Q6: Can Huijue Group provide energy storage solutions for centralized PV projects?
Yes. Huijue Group offers modular energy storage cabinet systems (50kWh-261kWh per unit) with LFP batteries, intelligent BMS and EMS, suitable for centralized PV+storage integration. Solutions support containerized deployment, parallel operation, and remote monitoring for utility-scale applications.
Tags: centralized photovoltaic, PV project development, utility-scale solar, solar plus storage, grid connection, energy storage, LFP battery, Huijue Group