
 chinahuijue@gmail.com
 +1 (702) 204-9855
Solar Payback Period: How Long to Recoup Your Investment in 2026
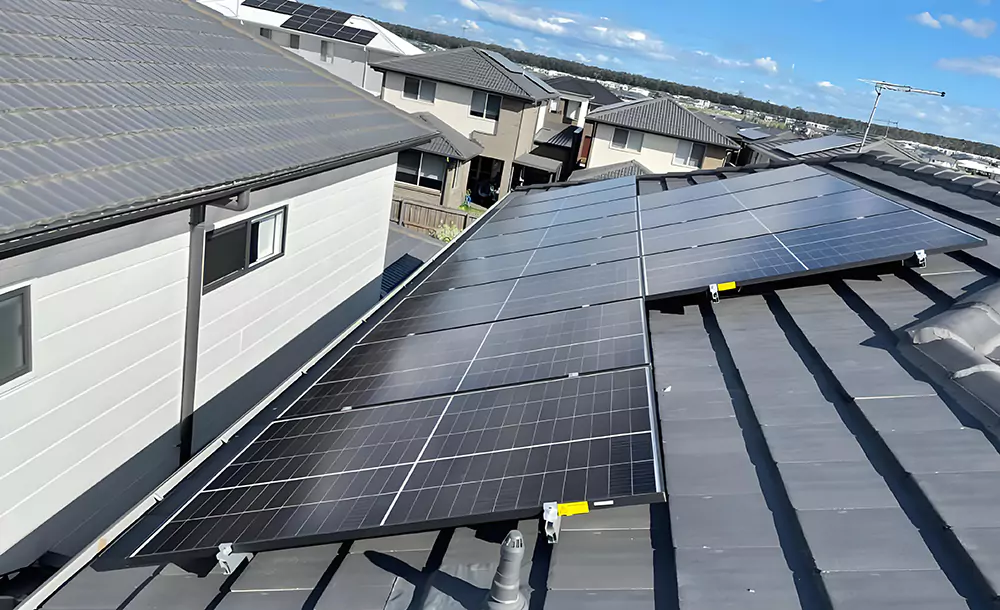
Solar energy adoption is accelerating — global installed capacity surpassed 1.6 TW in 2025. Yet the #1 question from homeowners and businesses remains: “How long until my solar investment pays for itself?” The answer depends on your location, electricity rates, system size, and available incentives. For a comprehensive understanding of rooftop solar PV system components and costs, understanding the payback timeline is the natural next step.
⚡ Quick Answer
| System Type | Typical Cost (After Incentives) | Avg. Payback Period | 25-Year Net Profit |
|---|---|---|---|
| Residential 5kW (Grid-Tied) | $6,000 – $12,000 | 5 – 8 years | $18,000 – $28,000 |
| Residential 5kW (Hybrid w/ Battery) | $10,000 – $18,000 | 7 – 11 years | $14,000 – $24,000 |
| Commercial 100kW | $70,000 – $120,000 | 3 – 5 years | $250,000 – $400,000 |
| Off-Grid Cabin 3kW | $4,000 – $8,000 | 6 – 10 years | $8,000 – $15,000 |
1. What Is the Solar Payback Period?
The solar payback period is the time required for cumulative electricity savings to equal the total system investment. After this point, the system generates effectively free electricity for the remainder of its 25-30 year lifespan.
Example: A $12,000 system (before incentives) with a 30% federal tax credit saves $1,680/year on electricity bills:
Net cost = $12,000 × (1 − 0.30) = $8,400
Payback = $8,400 ÷ $1,680 = 5.0 years
However, this simple formula doesn’t account for electricity rate inflation (avg. 3-5%/year), panel degradation (0.25-0.5%/year), or maintenance costs. A more accurate calculation uses net present value (NPV) over the system’s full lifespan.
2. The 5 Factors That Determine Your Payback Period
| Factor | Impact Level | Quantified Effect on Payback |
|---|---|---|
| Electricity Rate | 🔴 Critical | Double the rate → ~50% shorter payback. Germany (€0.40/kWh) pays back in 4yr vs. Egypt ($0.04/kWh) at 8yr. |
| Solar Resource | 🔴 Critical | 1,800 kWh/kWp (UAE) vs. 1,100 kWh/kWp (Germany) = 40% more generation, 2-3yr shorter payback. |
| System Cost | 🟡 High | $1.5/W (China) vs. $3.5/W (US) — same kW system, 2× cost difference, 2-4yr payback gap. |
| Government Incentives | 🟡 High | 30% US ITC cuts payback from 7→5yr. German VAT exemption saves €1,000-2,000. |
| Self-Consumption Ratio | 🟠 Medium | 70% self-use vs. 30% export at lower feed-in rates = 1-2yr payback difference. |
3. Regional Payback Period Comparison (2026)
Payback varies dramatically by region due to differences in electricity rates, solar irradiance, equipment costs, and policy. The table below covers major markets:
| Country / Region | Residential Rate | Solar Resource (kWh/kWp/yr) | 5kW Net Cost | Annual Savings | Payback |
|---|---|---|---|---|---|
| 🇺🇸 USA (California) | $0.30/kWh | 1,750 | $8,400 | $2,625 | 3.2 yr |
| 🇩🇪 Germany | €0.40/kWh | 1,100 | €5,600 | €440 | 4.5 yr |
| 🇦🇺 Australia | A$0.35/kWh | 1,650 | A$5,000 | A$1,400 | 3.6 yr |
| 🇦🇪 UAE (Dubai) | $0.08/kWh | 1,850 | $5,500 | $740 | 5.5 yr |
| 🇨🇳 China | ¥0.55/kWh | 1,300 | ¥15,000 | ¥3,500 | 4.3 yr |
| 🇧🇬 Bulgaria | €0.15/kWh | 1,350 | €6,500 | €1,000 | 6.5 yr |
| 🇪🇬 Egypt | $0.04/kWh | 1,800 | $5,000 | $360 | 8.0 yr |
| 🇰🇪 Kenya | $0.17/kWh | 1,700 | $6,000 | $720 | 7.0 yr |
| 🇵🇰 Pakistan | $0.07/kWh | 1,600 | $4,500 | $340 | 8.5 yr |
Note: Net cost = total cost after all applicable incentives. Annual savings includes self-consumption savings + feed-in/export income. Rates as of Q1 2026.
4. Cost Breakdown: Where Does Your Money Go?
Understanding the cost structure helps identify where savings are possible. Below is a typical 5kW residential grid-tied system breakdown:
| Component | Cost Range | % of Total | Notes |
|---|---|---|---|
| Solar Panels (5kW, TOPCon) | $2,000 – $3,500 | 30-35% | $0.40-0.70/W; TOPCon 700W+ modules preferred |
| String Inverter (5kW) | $800 – $1,500 | 12-15% | 99% efficiency; 10-12yr lifespan (replace once) |
| Mounting & Racking | $600 – $1,200 | 8-12% | Aluminum alloy; roof-type dependent |
| Cabling & Electrical | $400 – $800 | 5-8% | DC/AC cables, breakers, surge protection |
| Installation Labor | $1,500 – $3,000 | 20-25% | Varies by region; US highest, China lowest |
| Permitting & Inspection | $300 – $1,000 | 4-8% | US/EU higher; many emerging markets minimal |
| Monitoring System | $200 – $500 | 3-5% | Wi-Fi dongle + cloud platform |
| Total (Pre-Incentive) | $5,800 – $11,500 | 100% | Regional variation up to 2× |
Adding a 10kWh LFP battery increases total cost by $4,000-$7,000 (35-60%), extending payback by 2-4 years — but dramatically increasing energy independence. In regions with frequent outages or time-of-use rates, the battery can be essential. As we discussed in our analysis of why solar PV adoption remains low despite cost declines, storage cost is the single biggest barrier to faster payback in emerging markets.
5. Government Incentives by Country (2026)
| Country | Incentive Type | Amount / Benefit | Payback Impact |
|---|---|---|---|
| 🇺🇸 USA | Federal Investment Tax Credit (ITC) | 30% of system cost | Reduces payback by 2-3 years |
| 🇺🇸 USA (California) | SGIP Rebate (battery) | $0.15-0.25/Wh | Saves $1,500-$2,500 on battery |
| 🇩🇪 Germany | VAT Exemption (residential) | 19% savings | €1,000-2,000 off total cost |
| 🇩🇪 Germany | KfW Loan (0% interest) | Up to €30,000 | Eliminates financing cost |
| 🇦🇺 Australia | STC (Small-scale Tech Certificates) | ~$3,000-4,000 for 5kW | 30-40% cost reduction |
| 🇨🇳 China | Provincial Subsidies | ¥0.05-0.15/kWh for 5yr | 2-3yr shorter payback |
| 🇦🇪 UAE | Shams Dubai Net Metering | 50% retail rate credit | Modest; full retail needed |
| 🇧🇬 Bulgaria | EU Recovery Fund Grants | Up to 50% for <30kW | Halves payback period |
| 🇰🇪 Kenya | VAT Exemption (solar) | 16% savings | $500-900 off equipment |
6. 6 Strategies to Shorten Your Payback Period
| # | Strategy | Quantified Impact | Effort | Payback Reduction |
|---|---|---|---|---|
| 1 | Claim all available incentives | 30-50% cost reduction | Low (paperwork) | 2-3 years |
| 2 | Maximize self-consumption | Shift loads to daytime; 30%→70% self-use | Medium | 1-2 years |
| 3 | Choose TOPCon/HJT panels | +5-8% generation vs. PERC; slower degradation | Low | 0.5-1 year |
| 4 | Optimize tilt & orientation | South-facing at optimal angle = +10-15% | Low (design phase) | 0.5-1 year |
| 5 | Size system to 100-120% of consumption | Maximize ROI per dollar; avoid over-sizing | Low (planning) | 0.5-1 year |
| 6 | Use time-of-use optimization | Shift battery discharge to peak rates | Medium (needs battery) | 1-2 years (TOU regions) |
7. 25-Year ROI Projection: 3 Scenarios
Below is a 25-year financial projection for a 5kW system under three scenarios. Assumes 3% annual electricity rate inflation and 0.4% annual panel degradation.
| Year | Grid-Tied (No Battery) $8,400 net cost |
Hybrid (w/ 10kWh Battery) $14,000 net cost |
Off-Grid (Full Battery) $12,000 net cost |
|---|---|---|---|
| Year 1 | Save $1,680 (−$6,720) | Save $2,100 (−$11,900) | Save $1,500 (−$10,500) |
| Year 5 | ✅ Break-even (+$0) | −$3,500 | −$4,500 |
| Year 7 | +$3,500 | ✅ Break-even (+$0) | −$1,200 |
| Year 8 | +$5,200 | +$1,700 | ✅ Break-even (+$0) |
| Year 12 | +$12,000 (inverter replaced −$2,000) | +$8,500 (inverter replaced) | +$6,800 (battery maintenance −$500) |
| Year 20 | +$25,000 | +$22,000 | +$18,500 |
| Year 25 | +$32,000 | +$29,000 | +$24,000 |
Cumulative net savings (parentheses = still in payback period). Inverter replacement at year 12 factored in. Battery system assumed to retain 70% capacity by year 25.
8. Real-World Case Studies
📍 California, USA — 6kW Residential + 13kWh Battery
System cost: $28,000 → Net after 30% ITC + SGIP: $16,800
Annual savings: $3,200 (self-consumption + TOU arbitrage)
Payback: 5.3 years | 25-year profit: $48,000
📍 Sofia, Bulgaria — 5kW Residential Grid-Tied
System cost: €8,000 → Net after EU grant (50%): €4,000
Annual savings: €1,000 (€0.15/kWh, 1300 kWh/kWp)
Payback: 4.0 years | 25-year profit: €21,000
📍 Nairobi, Kenya — 3kW Off-Grid Cabin
System cost: $5,500 (panels + battery + inverter, VAT-exempt)
Annual savings: $620 (replacing diesel generator at $0.45/kWh)
Payback: 5.8 years | 20-year profit: $6,900
📍 Dubai, UAE — 10kW Commercial Rooftop
System cost: $12,000 (Shams Dubai program)
Annual savings: $1,850 (offsetting DEWA bill at $0.08/kWh)
Payback: 6.5 years | 25-year profit: $34,000
9. Frequently Asked Questions
What is the average solar payback period in 2026?
The average residential solar payback period ranges from 5 to 10 years globally. In high-electricity-rate regions like Germany (€0.40/kWh) or California ($0.30/kWh), payback can be as fast as 4-5 years. In emerging markets with lower rates but abundant sunshine like Egypt or Pakistan, payback typically runs 6-8 years. Commercial systems (100kW+) often achieve payback in 3-5 years due to economies of scale.
How do I calculate my solar payback period?
Use the formula: Payback Period = Net Installation Cost ÷ Annual Energy Savings. Net cost = total installation cost minus incentives and tax credits. Annual savings = (annual solar generation × local electricity rate) + any feed-in tariff income. For example, a $12,000 system after a 30% tax credit ($8,400 net) saving $1,680/year gives a 5-year payback.
Does adding battery storage increase the payback period?
Yes, typically by 2-4 years. A 10kWh LFP battery adds $4,000-$7,000 to system cost. However, batteries increase self-consumption from 30-40% to 70-80%, maximize time-of-use savings, and provide backup power. In regions with net metering 3.0 or time-of-use rates (California, Australia, Germany), batteries can actually shorten payback by shifting solar energy to peak-rate hours.
Which countries have the shortest solar payback periods?
As of 2026, the shortest payback periods are in: Australia (3-4 years, high rates + abundant sun), Germany (4-5 years, €0.40/kWh rates + VAT exemptions), California (4-5 years, NEM 3.0 + high rates), China (4-6 years, low equipment cost + subsidies), and UAE (5-6 years, excellent solar resource + declining panel costs).
What happens after the solar payback period ends?
After payback, your solar system generates effectively free electricity for its remaining lifespan. Quality panels last 25-30 years with 80-92% output retention. On a $12,000 system with 5-year payback, you could save $24,000-$36,000 in pure profit over years 6-25. Inverters typically need replacement at year 10-12 ($1,500-$3,000), which should be factored into long-term ROI.
Can solar panels lose efficiency and affect my payback period?
Yes. Quality monocrystalline panels degrade at 0.25-0.5% per year. By year 25, output drops to 80-88% of original. TOPCon and HJT panels degrade slower (0.25%/year) versus standard PERC (0.45%/year). Choosing low-degradation panels adds $500-$1,500 in lifetime savings. Factor 2-3% annual generation decline into your payback calculation for accuracy.
Ready to Calculate Your Solar ROI?
Get a customized payback analysis for your region and energy needs. Our team provides free system sizing and cost estimates for residential, commercial, and off-grid projects worldwide.