
 chinahuijue@gmail.com
 +1 (702) 204-9855
Home Solar Power Systems: Complete 2025–2030 Guide with Cost, ROI & Innovation
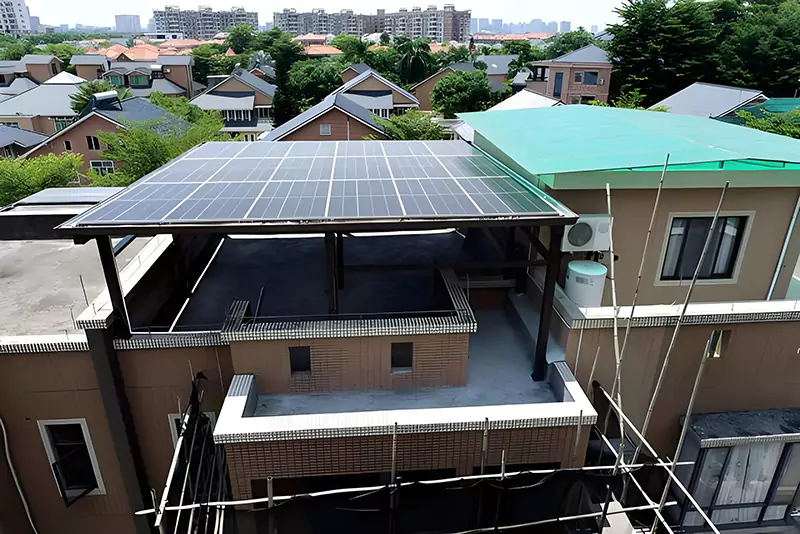
The global residential solar market reached 147.98 GW of installed capacity in 2025, projected to grow to 204.56 GW by 2030. With solar panel costs dropping below $0.30/watt and battery storage becoming mainstream, home solar power systems have evolved from an eco-friendly luxury to a strategic financial asset. This guide covers everything from cost breakdown and ROI analysis to cutting-edge innovations like Virtual Power Plants (VPP), Vehicle-to-Home (V2H) technology, and AI-driven energy management — helping you make an informed decision for your home’s energy future.
For homeowners seeking integrated container energy storage solutions that scale from residential to commercial applications, understanding the full landscape of home solar technology is the first step toward energy independence.
📊 Quick Answer: Home Solar Power Systems at a Glance (2025–2030)
| Metric | 2025 | 2030 (Projected) | Trend |
|---|---|---|---|
| Global residential solar capacity | 147.98 GW | 204.56 GW | ↑ 38% growth |
| Solar panel cost per watt | $0.28–$0.35 | $0.18–$0.22 | ↓ 35% decline |
| Average 6kW system cost (US) | $16,800 | $12,000 | ↓ 29% decline |
| Typical payback period | 6–9 years | 4–6 years | ↓ 33% shorter |
| Home battery adoption rate | 18% | 45% | ↑ 150% growth |
| VPP capacity (global) | 12 GW | 80–160 GW | ↑ 10× growth |
| V2H market size | $1.19B | $3.2B | ↑ 169% growth |
1. Why Home Solar Power Systems Are Reshaping Residential Energy
Home solar power systems convert sunlight into electricity using photovoltaic (PV) panels, providing households with clean, renewable energy. In 2025, the world added a record 698 GW of new solar PV capacity, bringing the global total to 2,383 GW — a 59-fold increase from just 40 GW in 2010. Residential installations account for a growing share of this expansion.
Several converging forces are driving residential solar adoption:
| Driver | 2025 Status | Impact on Homeowners |
|---|---|---|
| Electricity price inflation | Global avg +4.2% annually | Solar locks in fixed generation cost |
| Solar panel cost decline | $0.28–$0.35/W (down from $4/W in 2008) | System payback in 6–9 years |
| Government incentives | 30% US ITC, EU grants, Asian subsidies | Reduces upfront cost by 20–40% |
| Grid reliability concerns | Outages increasing in frequency | Solar+storage provides backup power |
| Climate commitments | 120+ countries with net-zero targets | Policy tailwinds accelerate adoption |
| EV adoption synergy | 17M+ EVs globally in 2025 | Solar charges EVs at near-zero cost |
The shift is not just about generating clean electricity — it’s about redefining how homes interact with the energy grid. Modern home solar power systems increasingly include battery storage, smart inverters, and software platforms that enable households to optimize self-consumption, participate in grid services, and even earn revenue from excess energy.
2. Environmental Impact & Carbon Reduction
One of the most compelling reasons homeowners choose solar is the significant environmental benefit. A typical 6 kW residential solar system offsets approximately 7,000–8,000 lbs of CO₂ annually, equivalent to planting 80 trees or taking one car off the road.
| Environmental Metric | Grid Electricity | Home Solar (6kW) | Solar + Storage |
|---|---|---|---|
| Annual CO₂ emissions (lbs) | 8,500–12,000 | 600–900 | 200–400 |
| 20-year CO₂ offset (tons) | 0 | 70–80 | 80–90 |
| Water consumption (gal/year) | 3,000–5,000 | ~0 | ~0 |
| NOx emissions (lbs/year) | 15–25 | 0 | 0 |
| SO₂ emissions (lbs/year) | 20–35 | 0 | 0 |
| Particulate matter (lbs/year) | 2–4 | 0 | 0 |
| Land use efficiency | Moderate | Rooftop (no extra land) | Rooftop (no extra land) |
Regional Carbon Impact Comparison
| Region | Grid Carbon Intensity (gCO₂/kWh) | 6kW Solar Annual Offset (tons CO₂) | Equivalent Trees Planted |
|---|---|---|---|
| Poland | 640 | 9.2 | 425 |
| Australia | 520 | 7.5 | 345 |
| USA (avg) | 385 | 5.5 | 255 |
| Germany | 340 | 4.9 | 225 |
| Japan | 460 | 6.6 | 305 |
| France | 85 | 1.2 | 55 |
| Norway | 30 | 0.4 | 20 |
Even in regions with relatively clean grids like France and Norway, home solar systems reduce reliance on imported energy and provide grid resilience benefits. In coal-heavy grids like Poland or Australia, the carbon offset is dramatic — a single 6 kW system in Poland saves as much CO₂ as planting 425 trees every year.
3. The True Economics: Cost Breakdown & ROI Analysis
Understanding the real cost of home solar power systems requires looking beyond the sticker price. A complete cost analysis includes upfront investment, available incentives, ongoing maintenance, and long-term energy savings.
System Cost by Size (2025 Average US Prices)
| System Size | Suitable For | Cost Before Incentives | After 30% Tax Credit | Annual Savings | Payback Period |
|---|---|---|---|---|---|
| 3 kW | Small apartment / 1-2 people | $8,400 | $5,880 | $650–$900 | 6.5–9 years |
| 5 kW | Medium home / 3-4 people | $14,000 | $9,800 | $1,100–$1,500 | 6.5–9 years |
| 6 kW | Standard family home | $16,800 | $11,760 | $1,300–$1,800 | 6.5–9 years |
| 8 kW | Large home / EV charging | $22,400 | $15,680 | $1,800–$2,400 | 6.5–8 years |
| 10 kW | Very large home / multiple EVs | $28,000 | $19,600 | $2,200–$3,000 | 6.5–8 years |
| 15 kW | Small business / farmhouse | $42,000 | $29,400 | $3,300–$4,500 | 6.5–8 years |
Cost Component Breakdown (6 kW System)
| Component | Cost | % of Total | Notes |
|---|---|---|---|
| Solar panels (16–20 panels) | $4,200 | 25% | $0.25–$0.30/W |
| Inverter (string or microinverter) | $1,800–$3,200 | 15–19% | Microinverters cost more |
| Mounting & racking | $1,400 | 8% | Roof type affects cost |
| Electrical & wiring | $1,200 | 7% | Includes permits |
| Installation labor | $3,360 | 20% | Varies by region |
| Permits & inspection | $800 | 5% | Local fees vary |
| Monitoring system | $500 | 3% | App-based tracking |
| Contractor overhead & profit | $3,540 | 21% | 15–25% margin |
| Total | $16,800 | 100% |
Global Cost Comparison by Country (5 kW System)
| Country | Avg Cost (USD) | Cost/Watt | Key Incentive | Avg Payback |
|---|---|---|---|---|
| Australia | $4,500 | $0.90 | STC certificates | 4–5 years |
| India | $3,200 | $0.64 | Central subsidy 40% | 3–5 years |
| China | $3,500 | $0.70 | Provincial subsidies | 4–6 years |
| Germany | $8,500 | $1.70 | Feed-in tariff / KfW loan | 7–9 years |
| USA | $14,000 | $2.80 | 30% federal ITC | 6–9 years |
| Japan | $12,000 | $2.40 | METI subsidy | 8–10 years |
| UK | $9,500 | $1.90 | 0% VAT on solar | 8–10 years |
| Brazil | $6,800 | $1.36 | Net metering | 5–7 years |
| South Africa | $7,200 | $1.44 | Load-shedding driven | 5–7 years |
25-Year Financial Projection (US 6 kW System)
| Year | Cumulative Savings | System Cost (Net) | Net Position | Notes |
|---|---|---|---|---|
| 1 | $1,550 | -$11,760 | -$10,210 | Year 1 savings |
| 5 | $8,400 | -$11,760 | -$3,360 | Inverter may need check |
| 7 | $12,400 | -$11,760 | +$640 | Break-even point |
| 10 | $18,200 | -$11,760 | +$6,440 | 55% ROI |
| 15 | $28,500 | -$11,760 | +$16,740 | 142% ROI |
| 20 | $40,200 | -$11,760 | +$28,440 | 242% ROI |
| 25 | $52,800 | -$11,760 | +$41,040 | 349% ROI |
Assumes 3% annual electricity price increase, 0.5% annual panel degradation, no battery replacement.
4. Energy Independence & Grid Resilience
Beyond cost savings, home solar power systems provide a critical layer of energy security. In regions prone to grid outages — from extreme weather events to aging infrastructure — solar systems paired with battery storage offer true energy independence.
Grid Reliability Comparison: Grid-Only vs Solar+Storage
| Scenario | Grid-Only | Solar Only (No Battery) | Solar + Battery Storage |
|---|---|---|---|
| Normal operation | Full power | Full power (day), grid (night) | Full power (24/7 self-sufficient) |
| 4-hour grid outage (daytime) | No power | Partial power (sunlight only) | Full power |
| 4-hour grid outage (nighttime) | No power | No power | Full power |
| 24-hour grid outage | No power | Partial (daytime only) | Full power (if sized correctly) |
| Multi-day outage | No power | Daytime only | Full power (with EV charging) |
| Energy cost during outage | N/A (generator fuel) | $0 | $0 |
| Noise during operation | Loud (generator) | Silent | Silent |
Grid Outage Frequency by Region (2024 Data)
| Region | Avg Outages/Year | Avg Duration (hours) | Solar+Storage Value Proposition |
|---|---|---|---|
| USA (Texas) | 12–18 | 3–8 | Critical for summer/winter storms |
| USA (California) | 8–14 | 2–6 | PSPS events drive adoption |
| South Africa | 200–300 | 2–4 | Load-shedding: solar+storage essential |
| Brazil | 15–25 | 2–5 | Storm-prone regions benefit |
| Germany | 1–3 | 0.5–1 | Low outage risk; more for economics |
| Australia | 6–10 | 1–3 | Bushfire season resilience |
| Japan | 3–6 | 1–4 | Earthquake preparedness |
For homes equipped with cabinet energy storage systems, grid resilience extends beyond just backup power — these systems can automatically switch between solar generation, battery storage, and grid power to optimize for cost and reliability simultaneously.
5. Home Energy Storage: The Game Changer
Adding battery storage transforms a solar power system from a daytime energy source into a 24/7 energy solution. In 2025, approximately 18% of new residential solar installations include battery storage — a figure expected to reach 45% by 2030.
Battery Storage Sizing Guide
| Home Type | Daily Usage (kWh) | Recommended Battery | Backup Hours | Estimated Cost |
|---|---|---|---|---|
| Small (1-2 people) | 10–15 kWh | 5–7 kWh | 8–10 hours | $5,000–$7,000 |
| Medium (3-4 people) | 20–30 kWh | 10–15 kWh | 8–12 hours | $8,000–$12,000 |
| Large (5+ people) | 35–50 kWh | 15–20 kWh | 8–12 hours | $12,000–$16,000 |
| With EV charging | 50–70 kWh | 20–30 kWh | 6–10 hours | $16,000–$24,000 |
Battery Technology Comparison (2025)
| Technology | Energy Density (Wh/kg) | Cycle Life | Cost ($/kWh) | Safety | Best For |
|---|---|---|---|---|---|
| LFP (Lithium Iron Phosphate) | 150–180 | 6,000–10,000 | $280–$350 | Excellent | Home storage (standard) |
| NMC (Nickel Manganese Cobalt) | 200–250 | 3,000–5,000 | $250–$320 | Good | Space-constrained homes |
| Semi-solid state | 250–320 | 5,000–8,000 | $450–$600 | Excellent | Premium homes (2025-2026) |
| Solid-state | 300–450 | 8,000–12,000 | $600–$800 | Outstanding | Future (2028-2030) |
| Sodium-ion | 100–150 | 4,000–6,000 | $200–$280 | Excellent | Budget home storage |
| Lead-acid (AGM) | 30–50 | 500–1,200 | $150–$250 | Moderate | Off-grid budget systems |
Self-Consumption Rates: Solar vs Solar+Storage
| System Configuration | Self-Consumption Rate | Grid Import | Grid Export | Annual Bill Reduction |
|---|---|---|---|---|
| Solar only (no battery) | 30–40% | High (evening) | High (midday) | 50–60% |
| Solar + 5 kWh battery | 55–65% | Moderate | Low | 70–80% |
| Solar + 10 kWh battery | 70–80% | Low | Very low | 85–92% |
| Solar + 15 kWh battery | 80–90% | Very low | Minimal | 92–96% |
| Solar + 20 kWh battery | 90–95% | Minimal | Minimal | 95–98% |
💡 Innovation Spotlight: Solar+Storage as a Revenue Generator
In 2025, more than 12 GW of distributed energy resources are participating in Virtual Power Plant (VPP) programs globally. Homeowners with solar+storage can earn $500–$1,500 per year by allowing their battery to discharge during grid peak demand events. The US DOE projects VPP capacity to reach 80–160 GW by 2030, creating a massive opportunity for participating households.
6. Property Value & Market Appeal
Installing a home solar power system is not just an energy decision — it’s a real estate investment. Multiple studies confirm that solar-equipped homes sell faster and at higher prices than comparable non-solar properties.
| Study/Source | Market | Property Value Increase | Sale Speed Premium |
|---|---|---|---|
| Zillow Research (2024) | USA | +4.1% | 20% faster |
| Lawrence Berkeley Lab | USA | +$15,000 (avg) | Not measured |
| Solar Energy UK | UK | +2–4% | Not measured |
| Realestate.com.au | Australia | +3–5% | 15% faster |
| IEA PVPS | Germany | +2–3% | 10% faster |
| Japan Real Estate | Japan | +3–4% | Not measured |
Home Buyer Preferences (2025 Survey)
| Feature | % Buyers Who Would Pay More | Avg Willing to Pay Extra |
|---|---|---|
| Solar panels (existing) | 67% | $8,000–$12,000 |
| Solar + battery storage | 78% | $12,000–$18,000 |
| EV charging capability | 71% | $3,000–$5,000 |
| Smart home energy management | 54% | $2,000–$4,000 |
| Grid-tied + backup capability | 62% | $5,000–$8,000 |
7. Installation, Maintenance & System Longevity
One of the most underappreciated advantages of home solar power systems is their simplicity and durability. With no moving parts in the panels and minimal maintenance requirements, solar systems are among the most reliable energy investments available.
Installation Timeline
| Phase | Duration | Key Activities |
|---|---|---|
| Site assessment | 1–2 days | Roof inspection, shading analysis, electrical assessment |
| System design | 3–7 days | Panel layout, inverter selection, permit drawings |
| Permitting | 2–6 weeks | Local building/electrical permits |
| Equipment delivery | 1–2 weeks | Panels, inverter, racking, battery |
| Installation | 1–3 days | Mounting, wiring, inverter setup |
| Inspection & PTO | 1–3 weeks | Utility inspection, Permission to Operate |
| Total timeline | 4–10 weeks |
25-Year Maintenance Schedule
| Maintenance Item | Frequency | Cost | DIY? |
|---|---|---|---|
| Panel cleaning | 1–2×/year | $150–$300 | Yes (if safe roof access) |
| System monitoring check | Monthly | $0 (app-based) | Yes |
| Inverter inspection | Annual | $100–$200 | No (electrician) |
| Electrical connection check | Every 3 years | $200–$400 | No (electrician) |
| Inverter replacement | Year 10–15 | $1,500–$3,000 | No (installer) |
| Battery replacement (if equipped) | Year 12–15 | $4,000–$8,000 | No (installer) |
| Panel-level inspection | Every 5 years | $300–$500 | No (professional) |
| Racking integrity check | Every 10 years | $200–$400 | No (professional) |
Component Lifespan Expectations
| Component | Expected Lifespan | Warranty (typical) | Replacement Cost |
|---|---|---|---|
| Solar panels | 25–30 years | 25 years (80% output) | $4,000–$6,000 |
| String inverter | 10–15 years | 10 years | $1,500–$2,500 |
| Microinverter | 20–25 years | 25 years | $200–$300/unit |
| Battery (LFP) | 10–15 years | 10 years (70% capacity) | $4,000–$8,000 |
| Mounting/racking | 25–30 years | 20 years | $1,000–$2,000 |
| Wiring & conduits | 25+ years | 10 years | $500–$1,500 |
| Monitoring system | 10–15 years | 5 years | $300–$500 |
8. The Innovation Frontier: V2H, AI & Virtual Power Plants
🚀 Three Technologies Transforming Home Solar in 2025–2030
Beyond traditional solar+storage, three emerging technologies are creating entirely new value streams for homeowners: Virtual Power Plants (VPP), Vehicle-to-Home (V2H) charging, and AI-driven energy management. These innovations turn home solar systems from passive energy generators into active market participants.
Virtual Power Plants (VPP): Your Battery Earns Money
A Virtual Power Plant aggregates thousands of home solar+storage systems into a single dispatchable resource that grid operators can call upon during peak demand. Homeowners receive payment for allowing their battery to discharge during these events.
| VPP Program | Region | Annual Earnings | Requirements |
|---|---|---|---|
| Tesla VPP (California) | USA | $750–$1,200 | Powerwall + grid connection |
| Sunrun VPP | USA (multiple states) | $500–$900 | Sunrun battery + enrollment |
| South Australia VPP | Australia | $600–$1,000 | Tesla Powerwall |
| Octopus Agile / Kraken | UK | $400–$800 | Compatible battery + smart meter |
| sonnenCommunity | Germany/Europe | $300–$600 | sonnen battery |
| Grid_rewards | Australia (various) | $400–$900 | Approved battery system |
Vehicle-to-Home (V2H): Your EV Is a Home Battery
V2H technology enables bidirectional charging — your electric vehicle’s battery can power your home during outages or peak-rate hours. With most EVs carrying 60–100 kWh of battery capacity (5–10× larger than typical home batteries), V2H transforms every EV into a massive home energy reserve.
| Metric | Home Battery (10 kWh) | V2H (EV 77 kWh) | Home Battery + V2H |
|---|---|---|---|
| Usable capacity | 9 kWh | 60 kWh (80% limit) | 69 kWh |
| Backup duration (2 kW load) | 4.5 hours | 30 hours | 34.5 hours |
| Cost of storage | $8,000–$12,000 | $2,500–$4,000 (charger) | $10,500–$16,000 |
| Daily cycling flexibility | Limited (10 kWh) | High (77 kWh) | Maximum |
| Grid services potential | Moderate | High | Very high |
| Best use case | Daily self-consumption | Backup + VPP revenue | Full energy independence |
The V2H bidirectional charging market was valued at $1.19 billion in 2025 and is projected to reach $6.93 billion by 2034, growing at a 21.5% CAGR. Major automakers including Ford, Hyundai, Nissan, and BYD are integrating V2H capability into new EV platforms.
V2H-Compatible EVs (2025)
| Vehicle | Battery Size | V2H Power Output | Backup Hours (2kW load) |
|---|---|---|---|
| Ford F-150 Lightning | 98–131 kWh | 9.6 kW | 40–55 hours |
| Hyundai IONIQ 5 | 77.4 kWh | 3.6 kW | 25–30 hours |
| Nissan Leaf | 39–62 kWh | 6 kW | 15–25 hours |
| BYD Seal (with V2H) | 82.5 kWh | 6 kW | 25–30 hours |
| Mitsubishi Outlander PHEV | 20 kWh | 1.5 kW | 8–10 hours |
| Rivian R1T | 135 kWh | 10 kW (planned) | 55–65 hours |
AI-Driven Smart Home Energy Management
Artificial intelligence is revolutionizing how home solar systems operate. AI algorithms analyze weather forecasts, electricity prices, household consumption patterns, and battery state to automatically optimize energy flows — deciding when to store, when to discharge, and when to sell to the grid.
| AI Feature | How It Works | Annual Savings | Availability |
|---|---|---|---|
| Load forecasting | Predicts household demand using historical data | $150–$300 | Most smart systems |
| Time-of-use optimization | Discharges battery during peak pricing | $300–$600 | Tesla, Sunrun, Enphase |
| Weather prediction | Pre-charges battery before cloudy days | $100–$200 | Premium systems |
| VPP dispatch optimization | Maximizes grid service revenue | $400–$800 | VPP-participating systems |
| EV charging optimization | Charges EV from solar surplus | $200–$400 | Smart charger systems |
| Fault prediction | AI detects system anomalies early | $100–$300 (repair savings) | Advanced monitoring |
| Total potential savings | $1,250–$2,600/year |
Emerging Innovation: Peer-to-Peer Energy Trading
| P2P Platform | Region | Model | Status (2025) |
|---|---|---|---|
| Powerledger | Australia, SE Asia | Blockchain P2P trading | Commercial |
| SonnenCommunity | Germany | Community energy sharing | Commercial |
| Vandebron | Netherlands | Direct producer-consumer | Commercial |
| Brooklyn Microgrid | USA (NY) | Local energy market | Pilot → Commercial |
| Piclo | UK | Flexibility trading | Commercial |
| Energo Labs | Australia | Tokenized energy | Pilot |
9. Future-Proofing Your Solar Investment: 2025–2035 Roadmap
A well-designed home solar power system should remain relevant and adaptable for 25+ years. Understanding the technology roadmap helps homeowners make decisions that won’t become obsolete.
Technology Evolution Timeline
| Technology | 2025 Status | 2027 Expected | 2030 Expected | 2035 Expected |
|---|---|---|---|---|
| Solar panel efficiency | 21–22% (PERC) | 23–25% (TOPCon) | 25–28% (HJT/Perovskite) | 28–32% (Tandem) |
| Panel cost ($/W) | $0.28–$0.35 | $0.22–$0.28 | $0.18–$0.22 | $0.12–$0.15 |
| Battery cost ($/kWh) | $280–$350 | $200–$250 | $120–$180 | $80–$120 |
| Smart inverter | Basic grid-tie | VPP-ready | AI-optimized standard | Autonomous grid agent |
| V2H integration | Limited models | 15% of new EVs | 40% of new EVs | 80% of new EVs |
| VPP participation | 12 GW global | 35–50 GW | 80–160 GW | 250+ GW |
| Home energy management | App-based | AI-predictive | Autonomous | Grid-interactive AI |
| Solid-state batteries | Pilot production | Niche commercial | Mainstream premium | Standard option |
Decision Framework: Which System Should You Choose?
| Homeowner Profile | Recommended System | Estimated Cost | Annual Savings | Key Benefit |
|---|---|---|---|---|
| Budget-conscious (first solar) | 5 kW solar, no battery | $9,800 (after ITC) | $1,100–$1,500 | Lowest payback period |
| Standard family home | 6 kW solar + 10 kWh battery | $18,500 (after ITC) | $1,800–$2,400 | 70%+ self-consumption |
| EV owner family | 8 kW solar + 15 kWh battery + V2H | $24,000–$28,000 | $2,500–$3,500 | EV charged by solar |
| Off-grid / rural | 10 kW solar + 30 kWh battery + generator | $35,000–$45,000 | Full independence | Complete grid independence |
| Future-ready premium | 10 kW solar + 20 kWh battery + V2H + VPP | $30,000–$38,000 | $3,500–$5,500 | Maximum revenue + resilience |
| Existing solar upgrade | Add battery + smart inverter | $8,000–$15,000 | $800–$1,500 additional | VPP participation enabled |
System Comparison: 20-Year Total Cost of Ownership
| Cost/Benefit Item | Grid-Only | Solar Only (6kW) | Solar+Storage (6kW+10kWh) | Solar+Storage+V2H+VPP |
|---|---|---|---|---|
| Initial investment | $0 | $11,760 | $18,500 | $26,000 |
| Inverter replacement (year 12) | $0 | $2,000 | $2,000 | $2,000 |
| Battery replacement (year 14) | $0 | $0 | $4,500 | $3,500 |
| Maintenance (20 years) | $0 | $2,500 | $3,500 | $4,000 |
| 20-year electricity cost | $42,000 | $18,500 | $6,000 | $2,000 |
| VPP revenue (20 years) | $0 | $0 | $6,000 | $18,000 |
| Property value increase | $0 | +$15,000 | +$18,000 | +$22,000 |
| 20-year net cost | $42,000 | $19,760 | $6,500 | -$4,500 (profit) |
The data is clear: while grid-only energy costs continue to rise, a fully integrated solar+storage+V2H+VPP system can actually generate net profit over 20 years when accounting for VPP revenue and property value appreciation.
10. Huijue Solar+Storage Solutions & Action Plan
For homeowners and businesses looking to implement integrated solar power systems, Huijue Group offers a comprehensive range of energy storage solutions designed for residential, commercial, and industrial applications.
Huijue Product Portfolio for Home Solar+Storage
| Product Line | Capacity Range | Application | Key Features | Best For |
|---|---|---|---|---|
| Residential BESS | 5–20 kWh | Home backup + self-consumption | LFP cells, smart BMS, app control | Standard family homes |
| Cabinet Energy Storage | 50–200 kWh | Large home / small business | Modular, scalable, grid-ready | Properties with high energy use |
| Container Energy Storage | 200 kWh–1 MWh+ | Commercial / community | Turnkey, outdoor-rated, VPP-capable | Multi-home / business complexes |
| Hybrid Inverter Systems | 3–15 kW | Solar integration | MPPT, grid-tie, off-grid switch | New solar installations |
5-Step Action Plan for Homeowners
| Step | Action | Timeline | Key Consideration |
|---|---|---|---|
| 1 | Assess your energy needs | Week 1 | Review 12 months of electricity bills |
| 2 | Evaluate solar potential | Week 1–2 | Roof orientation, shading, available space |
| 3 | Choose system configuration | Week 2–3 | Solar-only vs solar+storage vs full integration |
| 4 | Research incentives & financing | Week 3–4 | Tax credits, rebates, PPA vs purchase |
| 5 | Get quotes & select installer | Week 4–6 | Compare 3+ quotes, check certifications |
Whether you’re starting with a basic solar setup or building a fully integrated energy ecosystem with V2H and VPP participation, the key is to design for future expandability. A modular approach — starting with solar panels and adding battery storage, smart management, and V2H capability over time — allows you to scale your investment as technology matures and costs decline.
Ready to explore integrated solar+storage solutions? Visit our products page to browse the full range, or contact our team for a customized energy assessment.
Start Your Solar Journey Today
From rooftop solar panels to cabinet energy storage and container-scale solutions, Huijue Group provides end-to-end energy independence for homes and businesses worldwide.
FAQ: Home Solar Power Systems
Q1: How much does a home solar power system cost in 2025?
A: A typical 6 kW residential solar system costs $16,800 before incentives and $11,760 after the 30% US federal tax credit (or equivalent local incentives). Costs vary significantly by country — from $3,200 in India to $14,000 in the US for a 5 kW system. Adding battery storage increases the total by $5,000–$15,000 depending on capacity.
Q2: How long does it take for home solar to pay for itself?
A: The average payback period ranges from 4–5 years in Australia and India to 6–9 years in the US and Europe. By 2030, as panel costs decline further and electricity prices rise, payback periods are expected to shorten to 4–6 years globally. Adding battery storage extends payback by 1–2 years but increases long-term savings.
Q3: Can I use my EV to power my home with V2H technology?
A: Yes. Vehicle-to-Home (V2H) technology enables bidirectional charging, allowing your EV’s battery (typically 60–100 kWh) to power your home. Compatible vehicles include the Ford F-150 Lightning, Hyundai IONIQ 5, and Nissan Leaf. With a 77 kWh EV battery, you can provide 25–30 hours of backup power at 2 kW load — far exceeding most home battery systems.
Q4: What is a Virtual Power Plant and how can I participate?
A: A Virtual Power Plant (VPP) aggregates thousands of home solar+storage systems into a dispatchable grid resource. When grid demand peaks, the VPP discharges participating home batteries and pays homeowners $500–$1,500 per year. Programs like Tesla VPP (California), South Australia VPP, and sonnenCommunity (Germany) are available now. The US DOE targets 80–160 GW of VPP capacity by 2030.
Q5: Do solar panels work during a power outage?
A: Solar panels alone shut off during grid outages for safety reasons (anti-islanding). However, solar+storage systems with a backup-capable inverter automatically switch to island mode, powering your home from battery and solar. Systems with V2H can extend backup duration to 25+ hours using your EV’s battery.
Q6: Will adding solar increase my property value?
A: Yes. Studies from Zillow, Lawrence Berkeley Lab, and Solar Energy UK consistently show that homes with solar sell for 2–5% more than comparable non-solar homes. In the US, the average value increase is approximately $15,000. Homes with solar+storage command even higher premiums — 78% of buyers say they would pay extra for a home with both solar and battery storage.