
 chinahuijue@gmail.com
 +1 (702) 204-9855
Near Zero-Carbon Port Microgrid: Architecture, Costs & Implementation 2025-2026
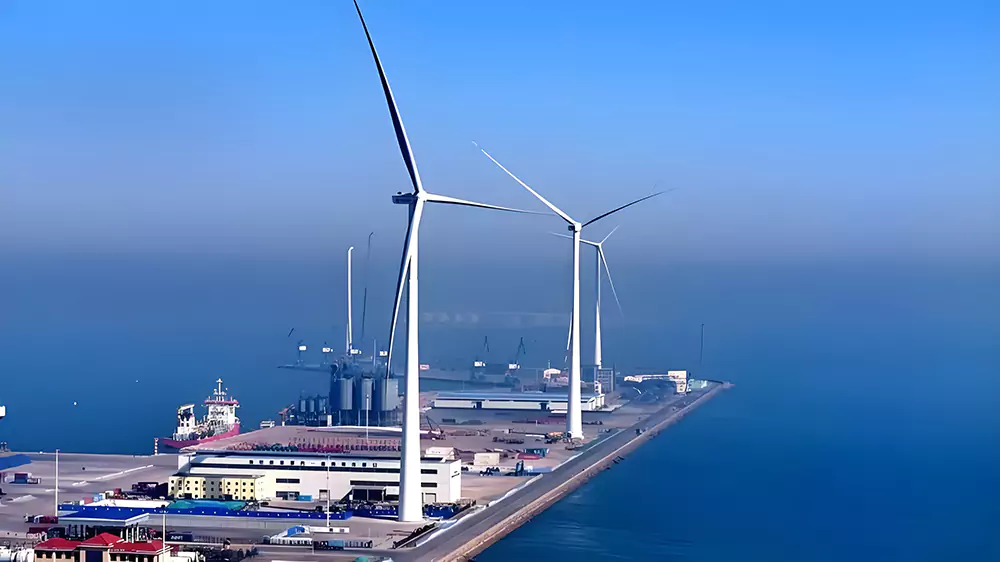
Ports are the arteries of global trade — and some of the world’s largest carbon emitters. A single large container vessel at berth can draw 10-20 MVA, equivalent to a small town. With over 40 terminals already offering shore power worldwide and regulatory mandates tightening across the EU, US, and Asia, the race to build near zero-carbon port microgrids has become one of the most critical decarbonization frontiers in the maritime industry.
This guide examines the architecture, economics, and implementation pathways for near zero-carbon port microgrids — from renewable generation and energy storage to shore power systems, regulatory frameworks, and real-world case studies at major global ports.
Quick Answer: Key Facts at a Glance
| Parameter | Data Point |
|---|---|
| Global microgrid market (2025) | $28.9 billion → $57.58B by 2034 (CAGR 18.3%) |
| Shore power CAPEX per berth | $10-20 million |
| Two-berth terminal total CAPEX | EUR 30-45 million |
| Ship power demand at berth | 2-20 MVA (varies by vessel type) |
| Local emission reduction (cold ironing) | 95% (NOx, SOx, PM) |
| CO₂ reduction with integrated microgrid | 60-95% (depending on configuration) |
| Simple payback period | 6-11 years (well-utilized systems) |
| LCOE reduction vs marine diesel | 67% |
| Global addressable berths | 5,000-10,000 (50-200 GVA total market) |
| Primary standard | IEC/ISO/IEEE 80005-1 (6.6 kV/60 Hz, 11 kV/50 Hz) |
| Regulatory deadline (EU AFIR) | 2030 for major ports |
| Regulatory deadline (California CARB) | 2027 for all CA ports |
1. What Is a Near Zero-Carbon Port Microgrid?
A near zero-carbon port microgrid is an integrated energy system that combines renewable generation, battery energy storage, intelligent distribution, energy management systems (EMS), and shore power infrastructure to reduce port operational carbon emissions to near-zero levels. “Near” zero carbon does not mean absolute zero — it refers to reducing emissions as far as practically possible during port operations.
Why Ports Are a Decarbonization Priority
Ports are critical nodes in international trade, handling over 11 billion tons of cargo annually. Traditional port operations rely heavily on fossil fuels — diesel for cranes and yard equipment, heavy fuel oil for ships at berth, and grid power often generated from coal or natural gas. The result: ports account for approximately 2-3% of global CO₂ emissions, with a single large port emitting 500,000+ tons of CO₂ annually.
| Emission Source | Share of Port CO₂ | Key Pollutants | Primary Mitigation |
|---|---|---|---|
| Ships at berth (auxiliary engines) | 40-55% | CO₂, NOx, SOx, PM | Shore power / cold ironing |
| Cargo handling equipment (RTG cranes, forklifts) | 20-30% | CO₂, NOx, PM | Electrification + battery |
| Port vehicles and trucks | 10-15% | CO₂, NOx, PM | Electric / hydrogen vehicles |
| Buildings and facilities | 5-10% | CO₂ | Solar PV + energy efficiency |
| Refrigerated containers (reefers) | 5-8% | CO₂, HFCs | Grid greening + monitoring |
From “Green Port” to “Zero-Carbon Microgrid”
The evolution from conventional ports to near zero-carbon operations follows a clear trajectory:
| Stage | Era | Key Technologies | Carbon Reduction | Typical CAPEX |
|---|---|---|---|---|
| 1. Conventional Port | Pre-2010 | Diesel equipment, grid power | Baseline (0%) | $0 incremental |
| 2. Green Port Initiatives | 2010-2020 | LED lighting, shore power pilots, some electrification | 10-20% | $5-15M per berth |
| 3. Hybrid Microgrid | 2020-2025 | Solar PV + battery + partial shore power + EMS | 30-50% | $15-30M per berth |
| 4. Near Zero-Carbon Microgrid | 2025-2030 | Full renewable + storage + shore power + electric equipment + green hydrogen | 60-95% | $25-50M per berth |
| 5. Zero-Carbon Port | 2030+ | 100% renewable + hydrogen + full electrification + AI optimization | 95-100% | $40-80M per berth |
2. Core Architecture: Five Key Subsystems
A near zero-carbon port microgrid integrates five critical subsystems. Each plays a distinct role in the energy supply chain from generation to end-use.
2.1 Renewable Energy Generation System
Most ports occupy vast coastal areas with access to abundant renewable resources — solar, wind, and in some locations, tidal energy. The renewable generation system is the foundation of any zero-carbon microgrid.
| Renewable Source | Typical Capacity | Installation Location | Capacity Factor | Cost ($/kW) | Best For |
|---|---|---|---|---|---|
| Solar PV (rooftop) | 0.5-10 MW | Warehouse roofs, terminal buildings | 15-25% | $800-1,500 | All ports with roof space |
| Solar PV (ground/carport) | 2-50 MW | Yard areas, parking, unused land | 15-25% | $700-1,200 | Ports with available land |
| Onshore wind | 2-20 MW | Breakwaters, coastal areas | 30-45% | $1,200-2,000 | Coastal ports with wind resource |
| Offshore wind (near-port) | 50-500 MW | Nearshore waters | 40-50% | $2,500-4,000 | Large ports near offshore wind farms |
| Tidal/wave energy | 0.5-5 MW | Estuary, tidal zones | 35-45% | $5,000-10,000 | Ports with high tidal range |
| Green hydrogen (electrolysis) | 1-20 MW | Port industrial zone | On-demand | $2,000-5,000 | Hydrogen-ready ports |
Example: The Port of Rotterdam has installed over 150 MW of offshore wind capacity and aims for 2 GW of electrolyzer capacity by 2030 to produce green hydrogen for port operations and bunkering.
2.2 Energy Storage System
Due to the intermittent nature of renewable energy, energy storage is indispensable in port microgrids. Storage systems buffer excess renewable generation and discharge during peak demand or low-generation periods, ensuring stable power supply.
| Storage Technology | Capacity Range | Duration | Efficiency | Cost ($/kWh) | Port Application |
|---|---|---|---|---|---|
| Lithium-ion (LFP) | 0.5-50 MWh | 1-4 hours | 90-95% | $200-400 | Peak shaving, frequency regulation |
| Lithium-ion (NMC) | 0.5-30 MWh | 1-4 hours | 90-95% | $250-450 | High power, limited space |
| Flow battery (Vanadium) | 1-100 MWh | 4-12 hours | 70-80% | $300-600 | Long-duration backup |
| Pumped hydro storage | 100-1,000 MWh | 6-24 hours | 75-85% | $100-200 | Ports near elevated water |
| Compressed air (CAES) | 50-500 MWh | 4-24 hours | 50-70% | $150-300 | Underground caverns nearby |
| Hydrogen storage | 10-1,000 MWh | Days-weeks | 40-60% | $500-1,500 | Seasonal storage, fuel cell |
| Thermal storage | 0.5-50 MWh | 4-24 hours | 80-90% | $30-100 | Port heating/cooling |
2.3 Intelligent Distribution System
An intelligent distribution system manages the real-time flow of electricity between generation sources, storage, shore power loads, and port operations. It monitors power demand and supply, distributes electricity by priority, and enables bidirectional interaction with the external grid.
| Distribution Component | Function | Key Specification | Port Standard |
|---|---|---|---|
| Smart switchgear | Automated circuit switching | 6.6-33 kV, SCADA-integrated | IEC 62271 |
| Solid-state transformer (SST) | Voltage conversion + frequency matching | 10-20 MVA, 50/60 Hz software-defined | IEC 61800 |
| Microgrid controller | Energy dispatch optimization | Real-time (< 100ms response) | IEEE 2030.7 |
| Power management system (PMS) | Load balancing, peak shaving | 15-min interval optimization | IEC 61850 |
| Grid interconnection | Bidirectional power exchange | SCADA + protection relay | IEEE 1547 |
| EV charging infrastructure | Electric truck/equipment charging | 150-350 kW DC fast charge | IEC 15118 |
2.4 Energy Management System (EMS)
The EMS is the “brain” of the near zero-carbon port microgrid. It monitors, controls, and optimizes the entire energy ecosystem in real time, using AI-driven algorithms to balance generation, storage, and consumption.
| EMS Function | Description | Optimization Target | Data Inputs |
|---|---|---|---|
| Generation forecasting | Predicts solar/wind output 24-72h ahead | Maximize renewable utilization | Weather, historical generation |
| Load forecasting | Predicts port power demand by berth/vessel | Minimize peak demand charges | Ship schedules, berth assignments |
| Storage dispatch | Optimal charge/discharge cycles | Minimize battery degradation | SOH, electricity prices, demand |
| Shore power scheduling | Coordinates multiple ships at berth | Maximize shore power utilization | Vessel ETAs, power ratings |
| Grid interaction | Peak shaving, demand response, export | Maximize revenue / minimize cost | Grid tariffs, market prices |
| Carbon tracking | Real-time CO₂ emission monitoring | Achieve carbon targets | Energy mix, emission factors |
| Anomaly detection | AI-based fault prediction | Prevent downtime | Sensor data, historical patterns |
2.5 Green Transportation & Port Equipment
Port transportation — including cranes, yard tractors, trucks, and vessels — represents 30-45% of total port emissions. Electrification of this equipment is essential for near zero-carbon operations.
| Equipment Type | Conventional (Diesel) | Electric/Electrified | Emission Reduction | Charging/Power |
|---|---|---|---|---|
| RTG cranes | 250-500 kW diesel | Electric RTG + regenerative braking | 80-95% | Grid-connected or battery |
| STS cranes | 1-3 MW diesel-hydraulic | Full electric (grid-powered) | 90-100% | 3-5 MW grid connection |
| Yard tractors/AGVs | 150-250 kW diesel | Battery-electric or hybrid | 70-95% | 100-350 kW DC charging |
| Reach stackers | 200-300 kW diesel | Battery-electric | 70-90% | 150-350 kW DC charging |
| Port trucks (on-road) | 300-400 kW diesel | Battery-electric or hydrogen FCEV | 80-100% | 350 kW DC or H₂ refuel |
| Tugboats / harbor vessels | 500-2,000 kW diesel | Battery-electric or hybrid | 50-90% | 1-5 MW shore charging |
| Intra-port ferries | 200-800 kW diesel | Full electric (auto-charging) | 90-100% | 0.5-2 MW shore charging |
3. Shore Power (Cold Ironing): The Critical Link
Shore power — also known as cold ironing, onshore power supply (OPS), or alternative marine power (AMP) — is the technology that allows ships to shut down their auxiliary diesel engines while at berth and draw electricity from the port’s microgrid. It is the single most impactful technology for reducing port-side emissions.
How Shore Power Works
| Step | Process | Equipment | Specification |
|---|---|---|---|
| 1. Utility/Microgrid input | AC power from grid or renewable microgrid | Grid connection / microgrid bus | 10-33 kV, 50/60 Hz |
| 2. Voltage transformation | Step-down to shore power voltage | Step-down transformer | 6.6 kV or 11 kV output |
| 3. Frequency conversion | Convert 50↔60 Hz as needed | Static frequency converter (SFC) or SST | ±0.5 Hz accuracy, >95% efficiency |
| 4. Cable management | Flexible cable to ship connection | Cable management system (CMS) | Multi-core, 6.6-11 kV rated |
| 5. Ship connection | Plug into ship’s shore power receptacle | Shore-to-ship plug/socket | IEC/ISO/IEEE 80005-1 compliant |
| 6. Load transfer | Seamless transfer from ship engine to shore | Synchronization controller | < 500ms transfer time |
| 7. Monitoring | Continuous power quality monitoring | Power quality analyzer | Voltage, frequency, harmonics (THD < 8%) |
Power Demand by Vessel Type
| Vessel Type | Typical Power (MW) | Peak Power (MVA) | Berth Time (h) | Energy per Call (MWh) | Annual Calls (est.) |
|---|---|---|---|---|---|
| Container 8,000-14,000 TEU | 4-8 | 6-10 | 12-18 | 60-90 | 300-500 |
| Container 14,000-22,000 TEU | 8-12 | 10-20 | 16-24 | 110-180 | 200-350 |
| Cruise 3,000-5,000 pax | 7-12 | 10-16 | 8-12 | 70-110 | 100-200 |
| Ro-Ro / Car carrier | 2-5 | 4-8 | 8-14 | 20-45 | 400-600 |
| Tanker | 1-3 | 3-6 | 18-36 | 30-80 | 150-300 |
| Bulk carrier | 1-4 | 3-6 | 24-72 | 40-200 | 100-250 |
Key Insight: A single large cruise ship or container vessel can draw 10-20 MVA — equivalent to the power demand of a small town. With 5,000-10,000 addressable berths globally, the total shore power equipment market is estimated at 50-200 GVA.
Technical Standards for Shore Power
| Standard | Title | Scope | Key Parameters |
|---|---|---|---|
| IEC/ISO/IEEE 80005-1 | High-voltage shore connection | HV AC shore-to-ship | 6.6 kV/60 Hz, 11 kV/50 or 60 Hz |
| IEC/ISO/IEEE 80005-2 | High-voltage shore connection – data exchange | Communication protocol | PLC, Ethernet |
| IEC/ISO/IEEE 80005-3 | Low-voltage shore connection | LV AC shore-to-ship | 440V/480V, 50/60 Hz |
| IEEE 1547 | Distributed energy interconnection | Grid-connected microgrid | Voltage, frequency, protection |
| IEEE 2030.7 | Microgrid controller specification | Energy management | Dispatch, optimization |
| IEC 62271 | High-voltage switchgear | Distribution equipment | 6.6-33 kV |
| IEC 61850 | Power utility automation | SCADA / substation | Communication, protection |
4. Global Case Studies
4.1 Port of Rotterdam (Netherlands)
| Parameter | Data |
|---|---|
| Annual throughput | ~439 million tons (largest in Europe) |
| Renewable capacity | 150+ MW offshore wind; 2 GW electrolyzer target by 2030 |
| Shore power | Mandatory for all berths by 2030 |
| Key initiatives | Hydrogen hub, floating solar, onshore wind |
| Investment | EUR 3+ billion in energy transition through 2030 |
| CO₂ target | 55% reduction by 2030 vs. 1990; net-zero by 2050 |
4.2 Port of Los Angeles / Long Beach (USA)
| Parameter | Data |
|---|---|
| Combined throughput | ~17 million TEU (largest in Western Hemisphere) |
| Shore power (AMP) | Operational since 2004; CARB mandate 2027 for all berths |
| Renewable energy | Solar PV on terminal rooftops; grid green procurement |
| Green corridor | LA-Long Beach-Shanghai green shipping corridor (2022 launch) |
| Equipment electrification | Zero-emission terminal equipment by 2030 |
| Emission reduction (since 2005) | ~85% reduction in port-related emissions |
4.3 Port of Shanghai / Yangshan (China)
| Parameter | Data |
|---|---|
| Annual throughput | ~49 million TEU (world’s busiest container port) |
| Shore power | Installed at Yangshan deep-water terminal; expanding |
| Green corridor | Shanghai-LA/Long Beach corridor; Shanghai-Guangzhou corridor |
| Hydrogen pilot | “Three Gorges Hydrogen Boat No. 1” — green hydrogen vessel |
| Electrification | Automated driverless AGVs at Yangshan Phase IV |
| Renewable integration | Offshore wind (nearby Donghai wind farm, 340+ MW) |
4.4 Other Notable Ports
| Port | Country | Key Initiative | Carbon Target |
|---|---|---|---|
| Hamburg | Germany | Shore power at all berths by 2025; onshore wind + hydrogen | Climate-neutral by 2040 |
| Vancouver | Canada | Shore power for cruise + container; EcoAction program | Net-zero by 2050 |
| Singapore | Singapore | Solar PV on terminal roofs; shore power trials; LNG bunkering | Net-zero by 2050 |
| Antwerp-Bruges | Belgium | Hydrogen import hub; shore power; 100+ MW solar | Climate-neutral by 2050 |
| Bremerhaven | Germany | Wind energy + cold ironing at container terminal | Climate-neutral by 2045 |
| Gothenburg | Sweden | Onshore power for 60% of ships; wind power procurement | 70% emission cut by 2030 |
5. Cost & Investment Analysis
5.1 Shore Power CAPEX Breakdown
| Cost Component | Two-Berth Terminal (EUR) | Per Berth (USD equiv.) | Share of Total | Notes |
|---|---|---|---|---|
| Grid connection / substation upgrade | 8M – 18M | $4.4M – $9.9M | 27-40% | Depends on grid proximity and capacity |
| Transformers and frequency converters | 12M – 20M | $6.6M – $11M | 40-44% | Static frequency converter or SST |
| Cable management system (CMS) | 4M – 8M | $2.2M – $4.4M | 13-18% | Flexible shore-to-ship cables |
| Protection, control, and civil works | 5M – 10M | $2.8M – $5.5M | 17-22% | Switchgear, SCADA, foundations |
| Total (two berths) | 29M – 56M | $16M – $31M per berth | 100% | Range reflects port conditions |
5.2 Revenue & ROI Model
| Revenue/Cost Item | Two-Berth Container Terminal | Notes |
|---|---|---|
| Annual shore power supplied | 90-140 GWh | Based on 300-500 vessel calls/year |
| Shore power tariff | EUR 110-150/MWh | Cost-reflective + margin vs. wholesale |
| Annual gross revenue | EUR 10M – 21M | 90-140 GWh × EUR 110-150/MWh |
| O&M cost (annual) | EUR 1.5M – 3M | 5-8% of CAPEX |
| Net annual revenue | EUR 8.5M – 18M | Before depreciation and financing |
| Total CAPEX | EUR 30-45M | Two-berth terminal |
| Simple payback period | 6-11 years | Well-utilized berths |
| Extended payback | 12-15+ years | Poor utilization or low price spread |
5.3 Integrated Microgrid Economics
When shore power is combined with on-site renewable generation and battery storage, the economics improve significantly:
| Configuration | CAPEX (per berth) | Annual O&M | LCOE ($/MWh) | CO₂ Reduction | Payback |
|---|---|---|---|---|---|
| Shore power only (grid-sourced) | $10-20M | $0.5-1M | $110-150 | 40-80% | 8-12 yrs |
| Shore power + 5 MW solar PV | $15-25M | $0.7-1.3M | $85-120 | 55-85% | 7-10 yrs |
| Shore power + PV + 10 MWh battery | $20-32M | $0.9-1.5M | $70-100 | 65-90% | 7-11 yrs |
| Full microgrid (PV + wind + storage + CHP) | $25-50M | $1.2-2M | $50-80 | 75-95% | 8-14 yrs |
| Full microgrid + green hydrogen | $35-60M | $1.5-2.5M | $60-100 | 90-98% | 10-18 yrs |
LCOE Comparison: Integrated port microgrids with CHP, solar PV, and battery storage can reduce the levelized cost of energy by 67% compared to traditional marine diesel generation, with additional 20% cost savings from thermal energy integration.
6. Emission Reduction Performance
6.1 Local Emission Reductions (Cold Ironing)
| Pollutant | Reduction (%) | Mechanism | Health Impact |
|---|---|---|---|
| NOx (Nitrogen Oxides) | >95% | Elimination of diesel auxiliary engines | Reduced respiratory disease |
| SOx (Sulfur Oxides) | >95% | No fuel oil sulfur content | Reduced acid rain |
| PM2.5 / PM10 | >95% | No particulate combustion emissions | Improved air quality |
| CO (Carbon Monoxide) | >90% | No incomplete combustion | Reduced toxicity exposure |
| VOCs | >85% | No fuel evaporation | Reduced smog formation |
| Noise pollution | 50-80% | Engine shutdown at berth | Improved community relations |
6.2 CO₂ Reduction by Microgrid Configuration
| Configuration | Annual CO₂ (baseline: 32,500 t) | Reduction (%) | Key Driver |
|---|---|---|---|
| Conventional (diesel + grid) | ~32,500 t | 0% (baseline) | Fossil fuel dependency |
| Cold ironing (grid-sourced) | ~19,500-25,000 t | 23-40% | Grid emission factor dependent |
| Natural gas CHP (with heat recovery) | ~19,500 t | ~40% | Efficient cogeneration |
| CHP + solar PV + battery | ~11,400-13,000 t | 60-65% | Renewable displacement |
| CHP + hydrogen blending (up to 50%) | ~9,100-10,700 t | 67-72% | Low-carbon fuel |
| Full renewable microgrid + hydrogen | <1,625 t | >95% | Near-zero carbon operation |
6.3 Case Study Emission Reductions
| Port / Terminal | Annual CO₂ Reduction | NOx/PM Reduction | Technology | Payback |
|---|---|---|---|---|
| North European container terminal | 55,000-65,000 t/year | >95% | Cold ironing + grid greening | ~8 years (with EU subsidy) |
| US West Coast cruise terminal | >80% CO₂e | >95% | AMP + renewable procurement | 10-12 years |
| Asian hybrid terminal | 30-50% (grid-dependent) | >90% | Cold ironing + partial solar | 12-15 years |
| Mediterranean container port | 40-60% | >90% | Shore power + 5 MW solar | 9-13 years |
7. Regulatory Framework & Mandates
The regulatory landscape for port decarbonization is tightening rapidly across all major regions. Understanding these mandates is critical for port operators planning microgrid investments.
| Region / Authority | Regulation | Requirement | Deadline | Scope |
|---|---|---|---|---|
| EU | AFIR (Alternative Fuels Infrastructure) | Shore power at TEN-T core ports | 2030 (container, Ro-Ro, cruise) | All EU major ports |
| EU | FuelEU Maritime | Shore power + fuel GHG intensity limits | 2030 + 2035 escalation | EU-port calls |
| USA (California) | CARB At-Berth Regulation | Shore power or equivalent for all vessels | 2027 | All California ports |
| International | IMO Carbon Intensity | CII rating: 11% / 40% / 70% reduction | 2026 / 2030 / 2050 | All IMO vessels |
| Japan / Korea | National mandates | Shore power at cruise/container terminals | 2028 | Major ports |
| Global | One Ocean Summit Declaration | Commitment to deploy shore-side electricity | 2028 | Signatory ports |
| China | MOT Green Port Guidelines | Shore power facilities at major terminals | Ongoing (2025-2030) | All coastal/river ports |
Compliance Risk: Ports that fail to deploy shore power by regulatory deadlines face significant penalties, loss of competitive advantage, and potential loss of vessel calls. California’s CARB can impose fines of $25,000-$100,000+ per violation day for non-compliance with the At-Berth Regulation.
8. Challenges & Solutions
8.1 Technical Challenges
| Challenge | Description | Impact | Solution |
|---|---|---|---|
| Grid capacity limitation | Local grid often limited to 3 MW vs. berth demand of 5-30 MW | Cannot serve multiple ships simultaneously | On-site generation + battery storage (microgrid) |
| Frequency conversion (50/60 Hz) | Ships may need 60 Hz while port grid is 50 Hz (or vice versa) | Requires expensive frequency converters | Solid-state transformer (SST) with software-defined frequency |
| Renewable intermittency | Solar/wind output varies with weather conditions | Unstable power supply to ships | Battery storage + grid backup + demand response |
| Voltage regulation | Maintaining stable voltage over long cable runs | Equipment damage risk | Automatic voltage regulators + reactive power compensation |
| Grid interconnection permitting | Complex approval process for new connections | 6-48 months delay | Early engagement with utility + modular deployment |
| Harmonic distortion | Power electronics create harmonics (THD > 8%) | Equipment malfunction, efficiency loss | Active harmonic filters + SST native suppression |
8.2 Economic Challenges
| Challenge | Impact | Mitigation Strategy |
|---|---|---|
| High upfront CAPEX ($10-20M/berth) | Financial barrier for smaller ports | EU/US subsidies, phased deployment, revenue sharing |
| Fuel-electricity price spread | Low spread extends payback to 15+ years | Carbon pricing, fuel taxes, green port incentives |
| Underutilization | Few ship calls = poor ROI | Mandatory shore power regulations increase utilization |
| Technology obsolescence risk | Rapidly evolving storage/converter tech | Modular design, vendor-neutral architecture |
| Split incentives | Port pays CAPEX; shipping line saves fuel | Port fee structures, tariff sharing agreements |
| Uncertain carbon credit value | ROI depends on future carbon prices | Conservative carbon price assumptions + option value |
8.3 Management Challenges
| Challenge | Description | Best Practice |
|---|---|---|
| Multi-stakeholder coordination | Port authority, terminal operator, utility, shipping lines, regulator | Green port partnership; dedicated project office |
| Standards harmonization | Different IEC/IEEE versions across regions | Adopt IEC/ISO/IEEE 80005 series as global baseline |
| Workforce training | New skills for microgrid operation and maintenance | Training programs, vendor partnerships |
| Cybersecurity | Connected microgrid vulnerable to cyber attacks | IEC 62443 compliance, network segmentation |
| Data interoperability | Different systems need to communicate seamlessly | Open protocols (IEC 61850, OPC UA) |
9. Market Outlook & Future Trends
9.1 Market Size & Growth
| Market Segment | 2025 Value | 2030 Forecast | CAGR | Key Driver |
|---|---|---|---|---|
| Global microgrid market | $28.9B | $57.6B (2034) | 18.3% | Resilience + decarbonization |
| Shore power / cold ironing | $1.5-2B | $5-8B | 20-25% | EU AFIR + CARB mandates |
| SST shore power market | Early stage | $500M | N/A (emerging) | SST technology maturation |
| Port energy storage | $0.8-1.2B | $3-5B | 25-30% | Battery cost decline + renewable integration |
| Port electrification (equipment) | $2-3B | $8-12B | 20-25% | Zero-emission terminal mandates |
| Total port decarbonization | $5-7B | $20-30B | 20-25% | Cumulative regulatory + market drivers |
9.2 Technology Trends (2025-2035)
| Trend | Timeline | Impact | Investment Readiness |
|---|---|---|---|
| Solid-state transformers (SST) | 2026-2028 pilots; 2030+ scale | Software-defined frequency, bidirectional power, native harmonic suppression | Early adopter / pilot stage |
| Green hydrogen at ports | 2027-2030 | Fuel cell shore power, hydrogen bunkering, seasonal storage | Demonstration projects active |
| AI-driven EMS | 2025-2027 | Predictive dispatch, demand forecasting, automated carbon trading | Commercial deployment |
| Vessel-to-grid (V2G) | 2028-2032 | Battery-electric ships discharge to port during peak | Concept / early pilot |
| Floating offshore wind near ports | 2026-2030 | Direct port supply of 100+ MW renewable energy | Under construction (multiple sites) |
| Blockchain energy trading | 2027-2030 | Peer-to-peer renewable energy trading between port tenants | Pilot stage |
| Autonomous electric port equipment | 2025-2028 | Driverless AGVs, automated cranes, optimized energy use | Deployed at leading ports |
9.3 Investment Forecast by Region
| Region | 2025-2030 Investment | Key Markets | Primary Driver | Shore Power Mandate |
|---|---|---|---|---|
| Europe | $8-12B | Rotterdam, Antwerp, Hamburg, Bremerhaven | EU AFIR + FuelEU Maritime | 2030 (TEN-T core ports) |
| North America | $5-8B | LA/Long Beach, New York/New Jersey, Vancouver | CARB At-Berth + federal funding | 2027 (California) |
| Asia-Pacific | $6-10B | Shanghai, Singapore, Yokohama, Busan | National mandates + green corridors | 2028 (Japan/Korea) |
| Middle East | $2-4B | Dubai, Jeddah, Abu Dhabi | Vision 2030 + smart port initiatives | Voluntary (incentive-based) |
| Latin America | $1-2B | Manaus, Santos, Callao | Sustainability commitments | Voluntary |
| Africa | $0.5-1B | Tanger Med, Durban, Mombasa | Green port development aid | Voluntary |
10. Implementation Roadmap
For port operators planning a near zero-carbon microgrid, the following phased roadmap provides a practical implementation framework:
| Phase | Timeline | Key Activities | Investment | Carbon Reduction |
|---|---|---|---|---|
| Phase 1: Assessment & Planning | 0-12 months | Energy audit, grid capacity assessment, regulatory mapping, feasibility study | $200K-500K | Baseline established |
| Phase 2: Shore Power Pilot | 12-36 months | Install shore power at 1-2 high-traffic berths, frequency converter, CMS | $15-30M | 15-25% |
| Phase 3: Renewable Integration | 24-48 months | Solar PV on rooftops/yards, battery storage, EMS deployment | $10-25M | 40-60% |
| Phase 4: Full Electrification | 36-72 months | Electric cranes/AGVs/trucks, EV charging, shore power at all berths | $30-60M | 65-85% |
| Phase 5: Near Zero-Carbon | 60-120 months | Green hydrogen, full renewable microgrid, AI optimization, carbon offset residual | $40-80M | 90-98% |
Key Suppliers: Major shore power and port microgrid technology providers include ABB, Wärtsilä, Siemens, Schneider Electric, Cavotec, and INNIO (Jenbacher). For energy storage and microgrid controllers, leading providers include BYD, Tesla, Sungrow, CATL, and SMA.
11. Frequently Asked Questions
What is a near zero-carbon port microgrid?
A near zero-carbon port microgrid is an integrated energy system that combines renewable generation (solar PV, wind, tidal), battery energy storage, intelligent distribution, and shore power to reduce port operational carbon emissions to near-zero levels. It is not absolute zero carbon, but reduces emissions by 60-95% compared to conventional fossil-fuel-powered port operations.
How much does a shore power system cost per berth?
Typical shore power installation costs $10-20 million per berth. For a two-berth container terminal, total port-side CAPEX ranges from EUR 30-45 million, including grid connection (EUR 8-18M), transformers (EUR 12-20M), cable management (EUR 4-8M), and protection/control systems (EUR 5-10M).
How much power does a ship need at berth?
Power demand varies by ship type: container ships (8,000-14,000 TEU) need 4-8 MW, large container ships (14,000-22,000 TEU) need 8-12 MW, cruise ships need 7-16 MVA, and Ro-Ro vessels need 2-5 MW. A single large cruise ship or container vessel can draw 10-20 MVA, equivalent to a small town.
What is the ROI and payback period for port microgrids?
Simple payback periods range from 6-11 years for well-utilized shore power systems. North European container terminals achieve approximately 8 years (with EU subsidies), while US West Coast cruise terminals see 10-12 year payback. Systems with poor utilization or low fuel-electricity price spreads may exceed 15 years. Integrated microgrids with CHP, solar, and storage can reduce LCOE by 67% compared to marine diesel.
What standards govern shore power systems?
The primary standard is IEC/ISO/IEEE 80005-1, which defines high-voltage shore connection specifications: 6.6 kV/60 Hz or 11 kV/50 Hz or 60 Hz. The IEC 80005 series covers safety, voltage, frequency, and plug interface requirements. Regulatory mandates include EU AFIR (2030), California CARB (2027), and IMO carbon intensity targets (11% by 2026, 40% by 2030, 70% by 2050).
How much can port microgrids reduce carbon emissions?
Cold ironing alone eliminates 95% of local port emissions (NOx, SOx, PM) and reduces CO₂ by 40-80% depending on grid mix. Integrated microgrids with natural gas CHP achieve 40% GHG reduction, adding PV and storage reaches 60-65%, hydrogen blending reaches 67-72%, and full hydrogen operation achieves over 95% reduction.
Which ports have implemented zero-carbon microgrids?
Over 40 terminals worldwide offered shore power in 2024-2025. Notable examples include the Port of Rotterdam (wind energy, shore power for all berths by 2030), Port of Los Angeles/Long Beach (AMP since 2004, LA-Shanghai green corridor), Port of Shanghai (shore power at Yangshan), and ports in Hamburg, Vancouver, and Singapore. The LA-Long Beach-Shanghai green shipping corridor is a flagship initiative.
What are the main challenges in building zero-carbon port microgrids?
Key challenges include: technical (renewable intermittency, grid capacity limits of 3-30 MW vs berth demand of 5-30 MW, frequency conversion), economic (high upfront CAPEX of $10-20M/berth, long payback periods, fuel-electricity price spreads), and management (multi-stakeholder coordination, standards harmonization, grid interconnection permitting taking 6-48 months).
12. Conclusion
Near zero-carbon port microgrids are no longer a futuristic concept — they are a regulatory necessity and an economic opportunity. With the global microgrid market projected to reach $57.6 billion by 2034, shore power mandates tightening across the EU (2030), California (2027), and Asia (2028), and proven emission reductions of 60-95%, the case for investment is compelling.
The key takeaways for port operators and investors:
| Priority | Action | Timeline | Expected Outcome |
|---|---|---|---|
| 1 | Conduct port energy audit and shore power feasibility study | Year 1 | Baseline + investment roadmap |
| 2 | Deploy shore power at high-traffic berths | Years 2-3 | 15-25% emission reduction |
| 3 | Install solar PV + battery storage + EMS | Years 2-4 | 40-60% emission reduction |
| 4 | Electrify port equipment and vehicles | Years 3-6 | 65-85% emission reduction |
| 5 | Integrate green hydrogen for near-zero operation | Years 5-10 | 90-98% emission reduction |
For ports and terminal operators seeking integrated energy storage and microgrid solutions, Huijue Group offers containerized energy storage systems specifically designed for industrial and port applications — with modular scalability from 100 kWh to multi-MWh installations, IP54 outdoor protection, and intelligent EMS integration.
Ready to Build Your Port Microgrid?
Huijue Group provides end-to-end energy storage and microgrid solutions for ports, terminals, and industrial facilities worldwide.
📦 Explore our product catalog | 📞 Contact us for a custom quote
Tags: Huijue Groupzero-carbon portport microgridshore powercold ironingport electrificationmaritime decarbonizationenergy storage