
 chinahuijue@gmail.com
 +1 (702) 204-9855
Containerized Solar Power System: Cost, Specifications & BESS Solutions for 2026
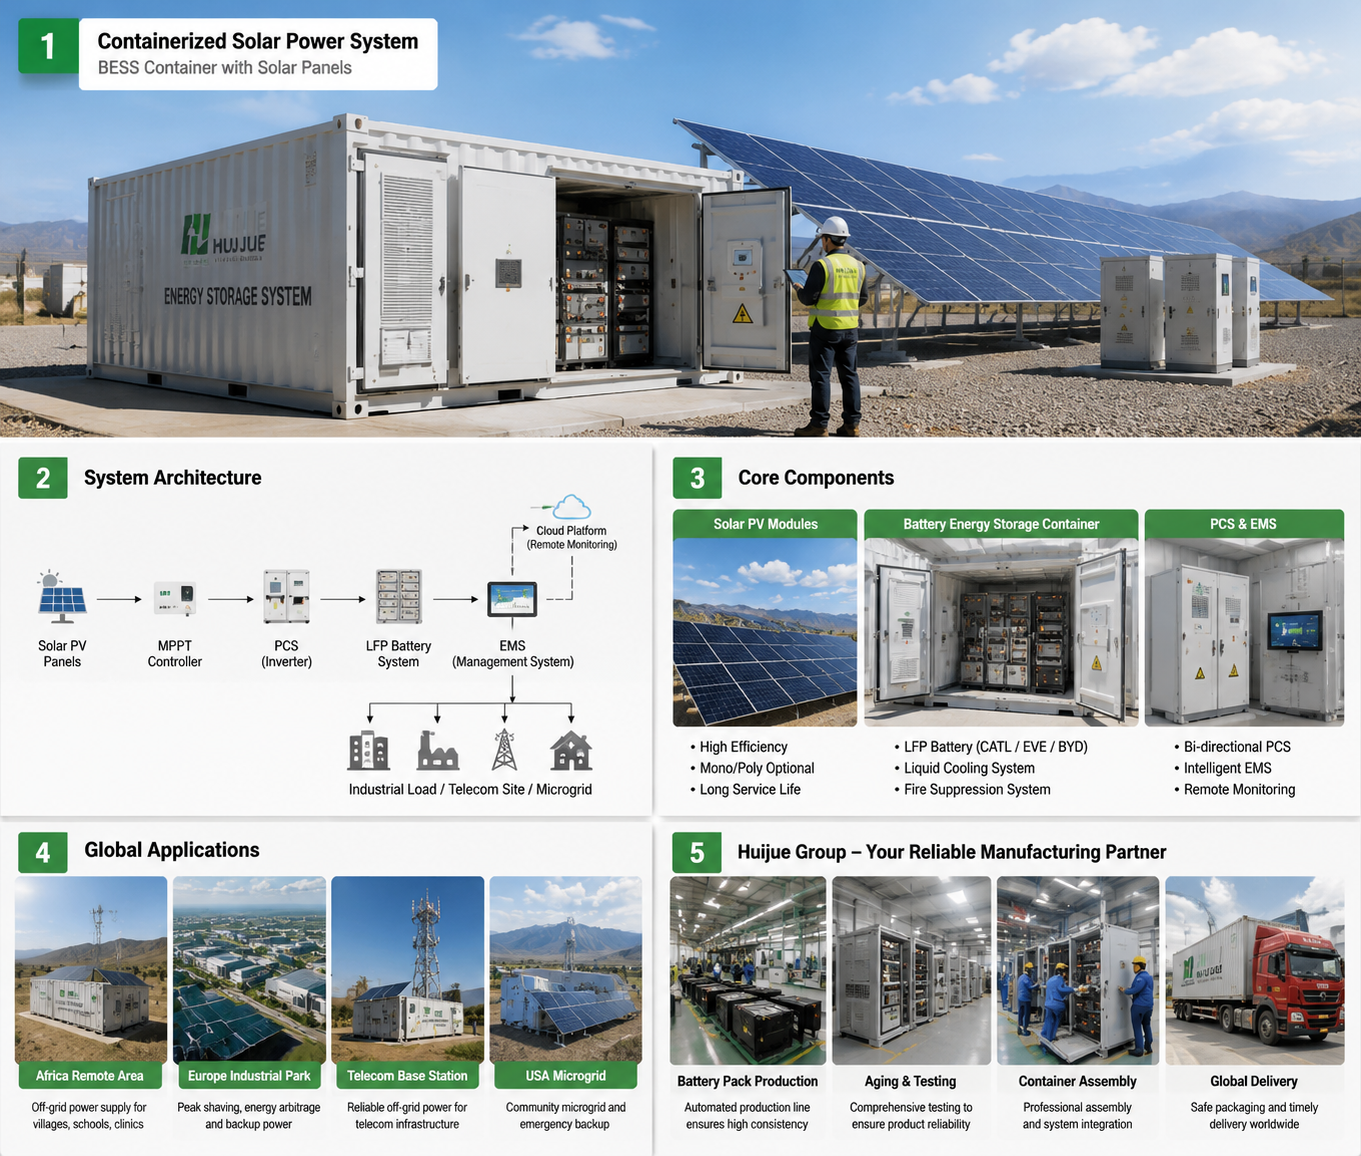
Featured: A 20ft containerized solar power system deployed in rural Africa, combining foldable PV arrays with LFP battery storage in a single ISO-standard container.
Quick Answer: 2026 Costs at a Glance
What does a containerized solar power system cost in 2026? Pricing depends on capacity, region, and configuration:
| System Type | Capacity | Cost (China Ex-Works) | Cost (US/Europe Installed) |
|---|---|---|---|
| Small C&I / Telecom | 50-215 kWh | $8,000 – $45,000 | $15,000 – $75,000 |
| Medium C&I | 500 kWh – 1 MWh | $100,000 – $235,000 | $140,000 – $320,000 |
| Utility-Scale BESS | 1-5 MWh | $195-$235/kWh | $255-$390/kWh |
| 1MW Solar + 2MWh Storage | 1 MW PV + 2 MWh | $550,000 – $780,000 | $750,000 – $1,100,000 |
Payback period: 3-5 years in diesel-dependent regions (Africa, remote areas); 6-9 years in grid-connected European markets with feed-in tariffs.
As a professional containerized solar power system manufacturer, Huijue Group has witnessed growing demand from Africa, Europe, and remote industrial projects in the renewable energy market. By pre-packaging solar generation, battery storage, power electronics, and control systems into standard ISO shipping containers, manufacturers deliver turnkey energy solutions that can be transported, installed, and commissioned in a fraction of the time required for conventional power infrastructure.
This guide breaks down everything procurement managers, project developers, and EPC contractors need to know: technical specifications, regional cost variations across Africa, Europe, and the United States, real-world deployment data from projects in Sudan, Ukraine, and the United States, and a practical framework for selecting the right containerized solar solution for your application.
—
1. What Is a Containerized Solar Power System?
A containerized solar power system integrates solar photovoltaic generation, battery energy storage (typically LFP lithium-ion), power conversion systems (PCS), and intelligent energy management into a single, transportable ISO standard shipping container. The concept originated from the need to deploy reliable power infrastructure quickly in remote locations — mining sites, telecom base stations, disaster recovery zones, and off-grid communities — where constructing a traditional power plant would be impractical or cost-prohibitive.
Unlike conventional solar installations that require extensive on-site civil work, electrical wiring, and system integration, containerized systems arrive pre-assembled and factory-tested. The deployment process is remarkably straightforward: prepare a flat concrete pad, deliver the container via standard truck or crane, connect the AC output cables, and commission the system. What traditionally takes weeks or months of on-site construction can be accomplished in 1-3 days.
The market has responded enthusiastically. According to BESS pricing benchmarks from SOLARTODO, standardized containerized BESS has become the dominant form factor for utility-scale projects between 2023 and 2026, driven by lithium price stabilization and the increasing penetration of LFP chemistry.
Key Insight: For energy storage companies. In a recent week of advertising data, container-related keywords achieved a 20% conversion rate — significantly outperforminFg generic solar terms. This signals strong commercial intent: buyers searching for these terms are typically in the final decision stage (BOFU) of their procurement journey.
2. Core Components of a Containerized Solar System
Understanding what goes inside the container helps buyers evaluate quotes and compare suppliers. A well-engineered containerized solar system contains six primary subsystems:
2.1 Solar PV Generation
Most containerized systems use high-efficiency monocrystalline TOPCon bifacial modules (580W-730W per panel). In foldable container designs, solar panels are mounted on the container roof during transport and deployed on-site using hydraulic or manual unfolding mechanisms. Fixed installations may use ground-mounted arrays adjacent to the container. The PV capacity typically ranges from 5kWp for small telecom applications to 2MW+ for utility-scale deployments.
2.2 Battery Energy Storage (BESS)
The battery system is the heart of any containerized solar solution. Lithium iron phosphate (LFP) has become the chemistry of choice for container applications due to its superior thermal stability, longer cycle life (6,000-8,000 cycles at 80% depth of discharge), and lower fire risk compared to NMC alternatives. According to CNTE’s 2026 procurement guide, LFP cells now dominate the container market, with Tier 1 manufacturers like CATL, EVE, and BYD supplying the majority of cells used in commercial systems.
| Specification | LFP (Standard) | NMC (Alternative) |
|---|---|---|
| Energy Density | 150-190 Wh/kg | 200-250 Wh/kg |
| Cycle Life (@80% DoD) | 6,000-8,000 cycles | 3,000-5,000 cycles |
| Thermal Runaway Threshold | 270°C | 210°C |
| 10-Year LCOS | Baseline | 25-30% higher |
| Fire Risk | Low | Moderate |
2.3 Power Conversion System (PCS)
The PCS handles bidirectional DC-to-AC conversion, typically operating at 1500Vdc for utility-scale systems. It accounts for 15-18% of total system cost and must be sized to handle both charging and discharging currents. Modern PCS units include grid-forming capabilities, reactive power support, and seamless transition between grid-tied and off-grid modes.
2.4 Battery Management System (BMS) & Energy Management System (EMS)
The BMS monitors individual cell voltages, temperatures, and state of charge, performing active balancing to extend battery life. The EMS sits above the BMS, making intelligent decisions about when to charge from solar, when to discharge to loads, and when to export surplus energy to the grid. Huijue Group’s EMS platform, for example, supports solar-storage-EV-diesel hybrid configurations with cloud-based monitoring — a feature particularly valuable for distributed telecom networks.
2.5 Thermal Management
Battery performance and longevity depend heavily on temperature control. Two cooling approaches dominate the market:
| Parameter | Liquid Cooling | Air Cooling |
|---|---|---|
| Initial Cost Premium | +6-9% | Baseline |
| Temperature Differential | ≤2°C across pack | >5°C |
| Annual Capacity Fade | 0.5-0.8% | 1.0-1.5% |
| Round-trip Efficiency | +0.5-1.0% | Baseline |
| Payback Period | 3-4 years | — |
For systems deployed in hot climates (Africa, Middle East, South Asia), liquid cooling is strongly recommended despite the initial cost premium. The reduced capacity fade alone justifies the investment within 3-4 years.
2.6 Safety Systems
Container fire suppression has evolved significantly. Current best practice involves multi-layer protection: smoke and gas detection sensors, Novec 1230 or perfluorohexanone (C6F12O) clean agent suppression, water mist backup, and automatic electrical isolation. The container shell itself is rated for C5 corrosion protection in coastal or industrial environments, with IP54-IP55 ingress protection.
3. Standard Configurations & Specifications
Containerized solar systems come in standardized configurations that align with ISO container dimensions. Here’s how the market segments by capacity:
3.1 Small-Scale: Telecom & Off-Grid (3.6kW – 50kWh)
Compact containers designed for single telecom base stations or small off-grid installations. These units typically use 10-foot containers and integrate 3.6-7.2kW of solar generation with 30-50kWh of LFP storage. Huijue’s Communication Container Station exemplifies this category, providing plug-and-play power for satellite communication base stations.
3.2 Medium-Scale: C&I & Microgrid (20kW – 430kWh)
These systems serve commercial facilities, small industrial operations, and community microgrids. Huijue’s foldable power generation and energy storage warehouse covers this range (18-150kW generation / 20-430kWh storage), using 20-foot containers with deployable solar arrays. The foldable design allows the container to transport compactly and expand its solar capacity on-site — a critical advantage for projects in remote locations.
3.3 Large-Scale: Utility & Grid (1MW – 6.25MWh+)
Utility-scale BESS containers represent the largest and fastest-growing segment. Standard configurations include:
| Configuration | Power Rating | Energy Capacity | Container Size | Typical Application |
|---|---|---|---|---|
| 1MW/2MWh | 1,000 kW | 2 MWh | 20ft | Grid peak shaving, renewable smoothing |
| 1.2MW/2.4MWh | 1,200 kW | 2.4 MWh | 20ft/40ft | C&I demand charge reduction |
| 1.25MW/2.5MWh | 1,250 kW | 2.5 MWh | 40ft | Solar farm co-location |
| 1MW/2.89MWh | 1,000 kW | 2.89 MWh | 40ft | 4-hour duration applications |
| 2MW/4MWh | 2,000 kW | 4 MWh | 40ft | Utility-scale energy shifting |
| 2.5MW/5MWh | 2,500 kW | 5 MWh | 40ft | Grid-scale capacity support |
| 3.45MW/6.25MWh | 3,450 kW | 6.25 MWh | 40ft | Large utility projects |
Huijue Group manufactures all of the above configurations, with the 5MWh and 6.25MWh systems using advanced liquid-cooling technology and 314Ah LFP cells to maximize energy density within standard container footprints.
4. 2026 Cost Analysis by Region
Containerized solar system costs vary significantly by region due to differences in labor rates, import duties, certification requirements, and grid interconnection costs. Below is a detailed breakdown for the three primary markets served by Huijue Group.
4.1 Africa: Diesel Displacement Drives ROI
In sub-Saharan Africa, containerized solar systems compete primarily against diesel generators, where fuel costs often exceed $1.20 per liter and supply chains are unreliable. The economics are compelling.
| Country | Diesel Price ($/L) | Grid Electricity ($/kWh) | 100kWh System Cost ($) | Annual Diesel Savings ($) | Payback (Years) |
|---|---|---|---|---|---|
| Sudan | $0.80 | $0.22 (unreliable) | $28,000-$42,000 | $8,000-$12,000 | 3.0-4.5 |
| Nigeria | $0.95 | $0.25 (frequent outages) | $30,000-$45,000 | $10,000-$15,000 | 2.5-3.5 |
| Kenya | $1.15 | $0.19 | $32,000-$48,000 | $12,000-$18,000 | 2.0-3.0 |
| Zimbabwe | $1.45 | $0.12 (rolling blackouts) | $30,000-$45,000 | $14,000-$20,000 | 1.8-2.5 |
| South Africa | $1.20 | $0.15 + demand charges | $35,000-$52,000 | $11,000-$16,000 | 2.5-3.5 |
Note: System costs include import duties and local installation. Diesel savings assume 60-80% fuel displacement for telecom or small industrial loads.
Real Case — Sudan: A 40-foot foldable PV container system deployed in Sudan delivers 129.6kWp of solar generation with 450kWh of LFP storage. The system operates in self-consumption mode, storing surplus solar energy in batteries and drawing from storage during non-sunlight hours. This project reduced diesel generator runtime by over 85%, cutting annual fuel costs by approximately $14,000 and achieving payback in under 4 years. View full case details.
4.2 Europe: Grid Services & Self-Consumption
European markets present a different economic picture. Grid electricity is more reliable but expensive ($0.25-$0.40/kWh), and regulatory frameworks reward self-consumption, peak shaving, and grid services. Import costs are higher due to CE certification requirements, labor rates, and grid connection studies.
| Country | Electricity Price ($/kWh) | Feed-in Tariff ($/kWh) | 500kWh System Cost ($) | Annual Savings ($) | Payback (Years) |
|---|---|---|---|---|---|
| Germany | $0.38 | $0.08 (feed-in) | $160,000-$210,000 | $22,000-$32,000 | 5.5-7.5 |
| Bulgaria | $0.15 | $0.06 | $140,000-$185,000 | $15,000-$22,000 | 6.5-9.0 |
| Ukraine | $0.12 (unstable grid) | N/A | $120,000-$160,000 | $18,000-$25,000 | 5.0-7.0 |
| United Kingdom | $0.32 | $0.07 (SEG) | $170,000-$220,000 | $20,000-$28,000 | 6.5-8.5 |
Note: Costs include CE certification, VDE-AR-E 2510-50 compliance for Germany, and standard grid interconnection fees.
In Ukraine, where grid infrastructure has been severely compromised, containerized solar systems serve a dual purpose: primary power supply and emergency backup. A 46kWp/50kWh foldable PV container system deployed there provides reliable electricity for community facilities, medical centers, and communication infrastructure — functions that would otherwise depend on diesel generators during extended outages.
4.3 United States: Demand Charge Management
The US market for containerized solar is driven by demand charge reduction, investment tax credits (ITC), and resilience requirements. Commercial electricity rates vary dramatically by state, with demand charges in California, Hawaii, and parts of the Northeast reaching $25-$45/kW per month.
| State/Region | Avg Commercial Rate ($/kWh) | Demand Charge ($/kW/mo) | ITC Benefit | 1MWh System Net Cost ($) | Payback (Years) |
|---|---|---|---|---|---|
| California | $0.22 | $35 | 30% federal + state incentives | $310,000-$380,000 | 4.5-6.0 |
| Texas | $0.08 | $15 | 30% federal | $290,000-$360,000 | 6.0-8.0 |
| New York | $0.19 | $28 | 30% federal + NYSERDA | $320,000-$400,000 | 5.0-6.5 |
| Hawaii | $0.35 | $40 | 30% federal + state | $330,000-$410,000 | 3.5-5.0 |
Note: Net costs reflect ITC application. Additional state-level incentives (SGIP in California, NY-Sun in New York) can further reduce costs by 10-25%.
5. Container Sizing Guide: How to Choose the Right Capacity
Selecting the correct container size is the single most important decision in the procurement process. Undersizing leads to power shortages; oversizing wastes capital. Here’s a practical framework:
Step 1: Determine Your Daily Energy Consumption
Sum up all loads (lighting, equipment, HVAC, telecom radios) and multiply by daily operating hours. For telecom base stations, this typically ranges from 5-15 kWh/day for a single-carrier site to 30-50 kWh/day for a multi-tenant tower.
Step 2: Calculate Required Storage Capacity
Storage (kWh) = Daily Consumption (kWh) × Autonomy Days ÷ Usable SoC Range
For most off-grid applications, 1-3 days of autonomy is standard. With LFP batteries operating at 80-90% usable state of charge:
| Application | Daily Consumption | Autonomy | Recommended Storage | Container Type |
|---|---|---|---|---|
| Single Telecom Site | 5-10 kWh/day | 2 days | 15-25 kWh | 10ft Communication Container |
| Multi-Tenant Tower | 20-40 kWh/day | 2 days | 50-100 kWh | 10ft/20ft BESS Container |
| Small Business/Rural Clinic | 30-60 kWh/day | 1.5 days | 60-120 kWh | 20ft Solar Storage Container |
| Industrial Facility | 200-500 kWh/day | 1 day | 250-600 kWh | 20ft/40ft BESS Container |
| Utility/Grid Support | 5,000+ kWh/day | 0.5 day (4-hour) | 2-5 MWh | 40ft Utility Container |
Step 3: Size the Solar Array
Solar capacity should generate 1.3-1.5× the daily consumption to account for system losses, weather variability, and battery charging efficiency. In high-irradiance regions (Africa, Middle East), a 1.2× multiplier may suffice; in Northern Europe, use 1.5-1.8×.
Step 4: Verify Container Footprint
Ensure the site can accommodate the container dimensions. Standard ISO containers measure 20ft (6.06m) or 40ft (12.19m) in length, 8ft (2.44m) in width, and 8ft 6in (2.59m) or 9ft 6in (2.89m) in height. Allow additional space for solar array deployment, ventilation clearance, and cable routing.
6. BESS Container vs. Traditional Solar: Key Differences
Buyers often ask whether a containerized approach is truly better than building a conventional solar-plus-storage system from scratch. The answer depends on project scale, timeline, and location.
| Factor | Containerized Solar System | Traditional On-Site Build |
|---|---|---|
| Deployment Time | 1-3 days (pre-assembled) | 4-12 weeks |
| On-Site Labor | Minimal (connect cables) | Extensive (civil + electrical) |
| Transportability | Standard truck/shipping | Permanent installation |
| Quality Control | Factory-tested (FAT before shipping) | Variable (site conditions) |
| Scalability | Add containers as needed | Requires redesign |
| Initial Cost | 5-15% higher (container premium) | Lower (no container shell) |
| 10-Year TCO | Lower (reduced O&M, faster deployment) | Higher (maintenance, downtime) |
| Best For | Remote sites, fast deployment, modular expansion | Large permanent installations with existing infrastructure |
For most projects serving telecom, mining, rural electrification, or rapid deployment scenarios, the containerized approach wins decisively. The factory testing advantage cannot be overstated — discovering a wiring fault or BMS communication error on a remote mountaintop costs exponentially more than catching it during factory acceptance testing (FAT).
7. Applications & Use Cases
Containerized solar power systems serve five primary application categories, each with distinct technical requirements:
7.1 Telecom Base Stations
Off-grid and bad-grid cell towers are the most common application for small-format containerized solar systems. A single 30-50kWh communication container can replace a diesel generator entirely, providing 24/7 power for radio equipment, backhaul radios, and site cooling. In Nigeria alone, thousands of telecom sites run on diesel generators at costs exceeding $40,000 per site annually. Containerized solar systems cut these costs by 60-92%, as demonstrated by real-world deployments.
7.2 Mining & Remote Industrial
Mining operations in Chile, Australia, and West Africa increasingly deploy containerized solar systems to offset diesel consumption. A copper mine in Chile successfully deployed a 3MW solar array with 2.4MWh of containerized energy storage, significantly reducing annual diesel fuel costs and carbon emissions. These systems must withstand extreme environmental conditions — dust, temperature swings, and vibration from heavy equipment.
7.3 Community Microgrids
Containerized solar mini-grids can electrify villages of 500-5,000 people without grid connection. Multiple containers are deployed in parallel, scaling generation and storage to match community demand. Southeast Asian island communities have successfully transitioned from diesel-dependent power to solar container microgrids, providing stable, affordable electricity for homes and small businesses.
7.4 Commercial & Industrial Peak Shaving
In markets with high demand charges (California, Hawaii, parts of Europe), containerized BESS systems reduce peak demand by discharging stored solar energy during the facility’s highest consumption periods. A 500kWh-1MWh container can shave 200-500kW of peak demand, translating to $3,000-$8,000 in monthly savings on demand charges alone.
7.5 Emergency & Disaster Response
The transportability and plug-and-play nature of containerized solar makes them ideal for disaster response. Following Hurricane Maria in Puerto Rico, containerized systems provided emergency power for critical infrastructure. Huijue’s mobile solar-storage containers have been deployed in Xinjiang, China for emergency power supply during disaster recovery, outdoor events, and temporary construction — each 10-foot foldable container providing 54kWp+36kWp generation with 241kWh storage.
8. Real-World Deployment Cases
Beyond the Sudan and Ukraine examples already discussed, here are additional real-world deployments that illustrate the versatility of containerized solar systems:
Case 1: Bosnia & Herzegovina — 1MW/2MWh Integrated Solar-Storage
This utility-scale project combines 1MW of solar generation with 2MWh of containerized LFP storage. The system features container-level perfluorohexanone fire suppression, grid-forming inverters, and advanced EMS with peak shaving, self-consumption optimization, and off-grid backup capability. The project demonstrates how containerized systems can serve both grid-tied revenue generation and resilience requirements simultaneously.
Case 2: United States — 5kWp Mobile Solar-Storage Container
A compact containerized solution deployed in the US for mobile emergency power and temporary construction site electricity. The system integrates solar panels, an energy storage cabinet, and EMS in a single transportable unit. Despite its small size (5kWp), it provides reliable off-grid power for tools, lighting, and communications equipment — demonstrating that containerized solar isn’t only for large-scale applications.
Case 3: China — 94MW/188MWh Utility-Scale BESS
China’s Lianyungang project represents the upper end of containerized BESS deployment. The system uses 20-foot standardized liquid-cooled container modules, each housing approximately 2-3.7MWh of LFP storage, deployed in parallel to achieve 94MW/188MWh total capacity. This project supports the nation’s largest “fishery-solar complementary” photovoltaic power station (940MW total installed capacity), enhancing renewable energy grid integration and stability.
Case 4: China — 365 Mobile Energy Storage Container
Designed for temporary construction site power, emergency repair operations, outdoor event power supply, and mobile rental applications, this container integrates LFP batteries with a comprehensive BMS. The “365” designation reflects its all-weather, all-terrain, all-application design philosophy. It represents a growing market segment: containerized systems designed not for permanent installation but for repeated redeployment across multiple sites.
Case 5: West Texas, USA — 250kW/500kWh LFP Telecom Container
A real-world LFP solar container deployed for telecom infrastructure in the Permian Basin region. The system achieved 92% diesel generator runtime reduction in its first year, saving over 15,000 gallons of diesel fuel annually. The LCOE dropped by more than 60% compared to the previous diesel-dependent configuration, with round-trip efficiency exceeding 95%.
9. 1MW Solar System Cost: Deep Dive
“1 megawatt solar system cost” is one of the most frequently searched terms in the containerized solar space. Let’s break down what a 1MW solar-plus-storage project actually costs in 2026:
Cost Structure Breakdown (1MW PV + 2MWh BESS Container)
| Component | Cost Range ($) | % of Total | Notes |
|---|---|---|---|
| Solar PV Modules (1MW) | $280,000-$380,000 | 28-32% | 580-730W TOPCon bifacial panels |
| BESS Container (2MWh) | $390,000-$540,000 | 38-42% | LFP, 1500Vdc, liquid-cooled, 20ft |
| PCS & Inverters | $120,000-$180,000 | 10-14% | Bidirectional, grid-forming |
| Mounting & BOS | $80,000-$120,000 | 7-9% | Ground mount, cabling, combiner boxes |
| EMS & Monitoring | $25,000-$45,000 | 2-3% | Cloud platform, SCADA integration |
| Installation & Commissioning | $60,000-$100,000 | 5-8% | Site prep, electrical, testing |
| Shipping & Logistics | $15,000-$35,000 | 1-3% | DG shipping for batteries |
| Total Turnkey | $970,000-$1,400,000 | 100% | Before incentives |
Costs vary by region. China-sourced systems with ex-works pricing run 30-40% lower. US/Europe installed costs include import duties, certification, and higher labor rates.
Hidden Costs to Budget For
Project budgets frequently overrun by 15-25% due to costs that don’t appear in equipment quotes:
- International shipping (dangerous goods): $5,000-$15,000 per container for battery classified cargo
- Grid interconnection study: $3,000-$10,000 for utility approval and impact analysis
- Site civil works: Concrete foundation, cable trenches, fencing, access road
- Import duties & taxes: Vary by country; US Section 301 tariffs add 7.5-25% on Chinese batteries
- Insurance: 1-2% of system value annually for property and liability coverage
- O&M reserve: $5,000-$15,000/year for remote monitoring, inspections, and component replacement
10. How to Choose a Containerized Solar Supplier
With dozens of manufacturers offering containerized solar systems, selecting the right partner requires careful evaluation. Here are the criteria that separate reliable suppliers from risky ones:
10.1 Verify Battery Cell Provenance
Request a detailed bill of materials (BOM) that identifies the battery cell manufacturer. Tier 1 cell makers (CATL, EVE, BYD, REPT) maintain strict quality control and provide cell-level traceability. Off-brand cells may save 8-12% upfront but often degrade faster and carry higher safety risks.
10.2 Demand Third-Party Test Reports
At minimum, request UL 9540A thermal runaway propagation test results, IEC 62619 certification, and UN 38.3 transport safety documentation. A supplier that cannot provide these is either cutting corners or using uncertified components.
10.3 Evaluate System Integration Experience
The container shell is the easy part — true differentiation lies in how well the BMS, PCS, EMS, and thermal management systems are integrated. Ask for references from projects of similar size and application. Huijue Group, for instance, has deployed containerized systems across Sudan, Ukraine, Bosnia, Cambodia, Bulgaria, the United States, and multiple Chinese provinces — providing a track record across diverse environments and grid conditions.
10.4 Confirm Performance Warranties
Standard warranties should cover: battery capacity ≥70% at year 8 (or ≥80% at year 10), PCS efficiency ≥97%, and EMS software updates for 5+ years. Negotiate replacement terms for cells that fall below guaranteed thresholds.
10.5 Assess After-Sales Support
Containerized systems are deployed in remote locations where on-site technical support is expensive and slow. Look for suppliers offering 24/7 remote monitoring, local service partnerships in your region, and guaranteed spare parts availability. The ability to diagnose and resolve issues remotely can save $5,000-$15,000 per site visit.
11. 2026 Market Trends & Technology Outlook
Several trends are shaping the containerized solar market in 2026 and beyond:
11.1 4-Hour Systems Becoming Standard
According to industry benchmarks, 4-hour duration systems are increasingly preferred over 2-hour configurations, particularly in grids with high solar penetration. The energy time-shifting and capacity value of longer-duration systems generate superior revenue in most market structures. Huijue’s 2.89MWh configuration (1MW power / 2.89MWh energy ≈ 3-hour duration) reflects this trend.
11.2 Liquid Cooling Proliferation
Liquid cooling, once reserved for high-power applications, is now standard in containers above 1MWh. The 6-9% initial cost premium pays back within 3-4 years through reduced capacity fade, improved efficiency, and lower HVAC energy consumption. Huijue’s 5MWh and 6.25MWh container systems both use liquid cooling as standard.
11.3 Volume Discount Economics
For multi-site deployments (telecom networks, mini-grid programs), volume pricing creates significant savings. Industry data suggests 5% discounts at 50+ unit orders, 10% at 100+ units, and 15% at 250+ units. This makes containerized solar particularly attractive for telecom operators planning nationwide rollouts.
11.4 314Ah Cells Driving Energy Density
The shift from 280Ah to 314Ah LFP cells has increased energy density within standard 20-foot containers by approximately 12%, allowing 2.5MWh systems in the same footprint that previously housed 2.0MWh. Next-generation 588Ah cells promise further density gains, potentially pushing 3MWh into a single 20-foot container.
11.5 Grid-Forming Inverters
Grid-forming (GFM) inverters are replacing traditional grid-following inverters in containerized systems, enabling containers to establish grid voltage and frequency independently. This is critical for off-grid and microgrid applications, allowing BESS containers to serve as the grid reference without requiring a synchronous generator.
12. Procurement Checklist
Before signing a purchase agreement for a containerized solar power system, use this checklist:
| # | Checklist Item | Status |
|---|---|---|
| 1 | Detailed BOM with cell manufacturer identified | ☐ |
| 2 | UL 9540A / IEC 62619 / UN 38.3 test reports provided | ☐ |
| 3 | Factory acceptance test (FAT) included in contract | ☐ |
| 4 | Site acceptance test (SAT) included in commissioning | ☐ |
| 5 | Performance guarantee: ≥70% capacity at year 8 | ☐ |
| 6 | EMS platform with remote monitoring capabilities | ☐ |
| 7 | Local service partner identified | ☐ |
| 8 | Spare parts list and pricing for 5-year operation | ☐ |
| 9 | Shipping logistics and DG handling confirmed | ☐ |
| 10 | Grid interconnection requirements reviewed | ☐ |
| 11 | Total cost of ownership (TCO) calculated, not just CAPEX | ☐ |
| 12 | Import duties and certification costs quantified | ☐ |
13. Frequently Asked Questions
Q: How much does a containerized solar power system cost in 2026?
In 2026, containerized solar power systems range from $195-$235/kWh ex-works in China for a 1MW/2MWh configuration, while installed costs in North America and Europe reach $255-$560/kWh depending on system size and duration. Utility-scale 2-hour systems typically cost $210-$320/kWh, while C&I systems range from $280-$480/kWh. Total turnkey pricing for a 1MW/2MWh BESS container falls between $390,000 and $640,000.
Q: What is the difference between a BESS container and a solar storage container?
A BESS container (Battery Energy Storage System container) stores electricity in lithium-ion batteries housed in a standard ISO shipping container, typically without integrated solar generation. A solar storage container combines both solar PV generation and battery storage in a single containerized unit, often featuring foldable solar panels that deploy on-site. Solar storage containers are self-contained power plants, while BESS containers require an external power source for charging.
Q: What size containerized solar system do I need for a telecom base station?
For a typical off-grid telecom base station consuming 5-15kWh per day, a 30-50kWh solar storage container (such as Huijue’s Communication Container Station at 3.6-7.2kW / 30-50kWh) is usually sufficient. For sites with higher loads or multiple carriers sharing infrastructure, 100-215kWh systems are recommended. The system should provide 1-3 days of autonomy to handle periods of low solar irradiance.
Q: How long does it take to deploy a containerized solar power system?
Containerized solar power systems are pre-assembled and factory-tested, reducing on-site deployment time by approximately 70% compared to traditional installations. A standard 20ft BESS container can be operational within 1-3 days after delivery: pour the concrete foundation, connect AC/DC cables, and commission the system. Larger multi-container installations typically require 1-2 weeks for full integration and grid connection.
Q: Are containerized solar systems suitable for African markets?
Yes. Containerized solar systems are ideal for African markets where grid instability is common and diesel generator costs are high. Countries like Sudan, Nigeria, Kenya, and Zimbabwe benefit significantly from solar containers for telecom base stations, rural electrification, and industrial applications. Real deployments in Sudan (129.6kWp/450kWh) and Nigeria (multiple telecom sites) demonstrate 60-92% diesel cost reduction, with payback periods of 3-5 years in regions where diesel exceeds $1.20/liter.
Q: What certifications should I look for in a BESS container?
Key certifications for BESS containers include UL 9540/9540A (thermal runaway testing, North America), IEC 62619 (battery safety, international), UL 1973 (battery cells), UN 38.3 (transport safety), and IEC 60730 (automatic controls). For European markets, VDE-AR-E 2510-50 compliance is important. Always request third-party thermal runaway propagation test reports and verify that battery cells come from Tier 1 manufacturers like CATL, EVE, or BYD.
Summary: Why Containerized Solar Makes Sense in 2026
Key Takeaways
- Fast deployment: Factory-assembled containers reduce on-site work by 70%, operational in 1-3 days
- Proven ROI: 2-5 year payback in diesel-dependent markets (Africa, remote sites); 4-8 years in grid-connected markets
- LFP dominance: 6,000-8,000 cycle life, superior safety, and declining costs make LFP the clear chemistry choice
- Modular scalability: From 30kWh telecom containers to 6.25MWh utility systems — grow capacity by adding containers
- Total cost of ownership: Despite 5-15% higher initial cost vs. traditional builds, containerized systems win on 10-year TCO through reduced O&M and faster deployment
- Real-world validation: Deployments across Sudan, Ukraine, Bosnia, USA, China, Chile, and Nigeria demonstrate reliable performance across diverse environments
As both a manufacturer and solution designer, Huijue Group offers containerized solar systems from 3.6kW/30kWh communication containers to 3.45MW/6.25MWh utility-scale BESS — all with factory testing, global certifications, and 24/7 remote monitoring. Explore deployment cases or contact our engineering team for project-specific sizing and pricing.
About the author: This article is produced by Huijue Group’s technical engineering team, drawing on deployment data from projects across Africa, Europe, Asia, and the Americas. Cost data references 2026 Q2 market benchmarks from SOLARTODO and CNTE procurement guides, supplemented by BloombergNEF and IRENA industry reports. All case studies reference real projects from Huijue’s deployment portfolio and publicly documented industry installations.
Last updated: July 2026. Costs and specifications reflect Q2 2026 market conditions and are subject to change based on raw material prices, exchange rates, and regulatory updates.