
 chinahuijue@gmail.com
 +1 (702) 204-9855
Hybrid Solar Systems: The Commercial Buyer’s Guide to PV Plus Storage
Europe logged a record number of negative electricity price hours in 2025. Solar PPA prices slipped below €35/MWh. In Australia, BloombergNEF analysts concluded that utility-scale PV annual additions may have already peaked—not because demand is falling, but because midday capture prices have collapsed under the weight of solar oversupply.
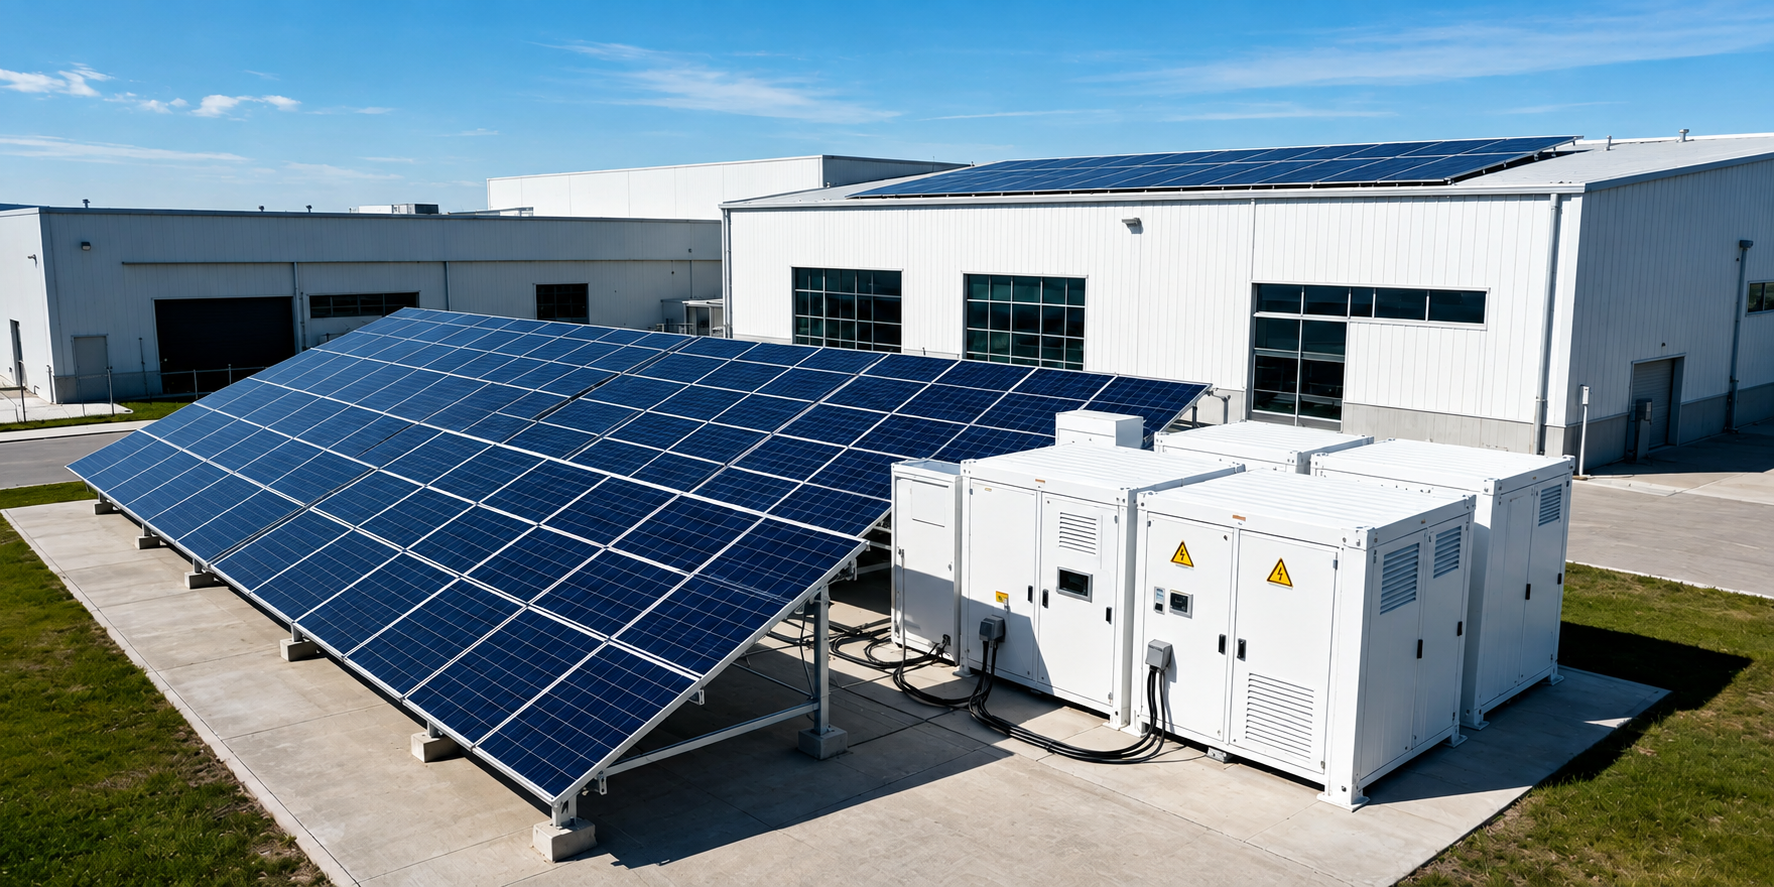
The message is blunt. A solar farm without storage is becoming a stranded asset class. The fix is hybrid solar systems—PV co-located with battery storage behind a single interconnection point, managed by a hybrid inverter that arbitrages between generation, consumption, and grid dispatch.
For commercial and industrial buyers, the shift from standalone PV to PV-plus-storage changes everything about system design, procurement, and financial modeling. This guide breaks down the architecture decisions, sizing economics, and supplier evaluation criteria that determine whether a hybrid deployment delivers 4-year payback or 10-year disappointment.
Why Standalone PV Projects Are Bleeding Revenue
The solar cannibalization effect is no longer theoretical. When the sun shines brightest, every megawatt of installed PV floods the market simultaneously, and wholesale prices crater. The Pexapark Q3 2025 index showed European solar PPA prices at €34.25/MWh—down from €51/MWh just eighteen months earlier. During peak solar hours in Germany and Spain, spot prices regularly went negative.
The mathematics are unforgiving. A 10 MW solar farm generating at full output during a negative-price hour pays the grid to take its electricity. Over a year, these negative-price erode 15–25% of standalone PV revenue in high-penetration markets, according to Aurora Energy Research modeling. The same analysis shows that adding a 4-hour battery sized at 40% of PV capacity recovers roughly 80% of that lost revenue by shifting generation to evening peak hours.
China’s solar manufacturers felt the supply-side consequences. TCL Zhonghuan guided a 2025 net loss of 8.2–9.6 billion yuan. JA Solar forecast losses of 4.5–4.8 billion yuan. Module prices bottomed near $0.10/W, which sounds great for buyers but signals a sector in structural distress. Cheap modules, paradoxically, make the hybrid case stronger—the capital freed by lower PV costs can fund the battery component without inflating total project cost.
IRENA’s 2025 capacity report recorded 452.1 GW of new solar PV installations in 2024 alone, bringing global renewable capacity to 4,443 GW. That volume is overwhelming grid infrastructure. Storage is the only technology that can decouple generation timing from consumption timing at scale.
The cannibalization curve is steepening. Aurora Energy Research projects that by 2028, standalone solar capture rates in the UK could fall below 60% of base load prices during summer months—meaning a solar asset nominally rated at £50/MWh earns closer to £30/MWh because it only generates when prices are depressed. A hybrid system with 4-hour storage lifts the capture rate back above 85% by shifting 30–40% of generation into evening hours when prices peak.
For commercial buyers, the cannibalization effect manifests differently. A factory running rooftop solar without storage exports surplus midday generation at wholesale prices (often near zero or negative) while purchasing evening power at retail rates. The spread between what the solar earns on export and what the facility pays on import is the self-consumption gap—and it is widening every year as more solar enters the grid.
DC-Coupled vs AC-Coupled: The Architecture Decision
Every hybrid solar system faces a fork: DC-coupled or AC-coupled. The choice affects round-trip efficiency, capex, retrofit feasibility, and revenue potential for the next 15 years. Getting it wrong is expensive.
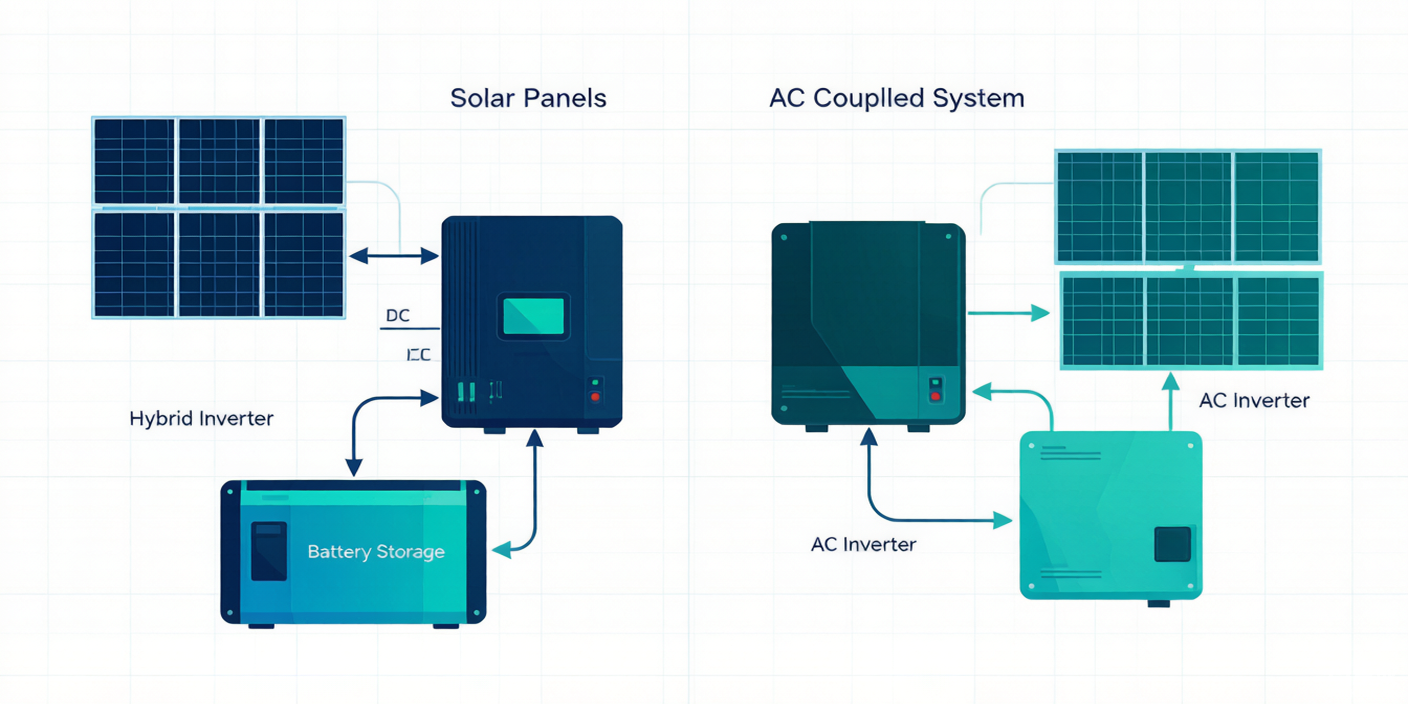
In a DC-coupled system, PV arrays and batteries connect on the DC side of a single hybrid inverter. Solar generation charges the battery directly through a DC-DC converter, bypassing the inversion-to-AC-then-rectification-back-to-DC round trip. Research published in the MDPI journal Energies, analyzing a 288 MWp PV plant with 275 MWh BESS, found DC-coupling delivers 1–3 percentage points higher round-trip efficiency at BESS/PV ratios around 20%.
AC-coupled systems keep PV and battery on separate inverters, both feeding AC to a common point of interconnection. This architecture shines in retrofits—existing solar installations can add storage without re-engineering the PV side. Yaskawa Solectria’s technical white paper notes that DC-coupled configurations allow DC/AC ratios up to 2.5, meaning significantly more panel capacity can be connected to a given inverter rating without clipping losses.
| Parameter | DC-Coupled | AC-Coupled |
|---|---|---|
| Round-trip efficiency | 92–95% | 88–91% |
| Max DC/AC ratio | Up to 2.5 | Typically 1.3–1.5 |
| Best for | New builds, greenfield | Retrofits, existing PV |
| Clipping recovery | Yes (clipped energy charges battery) | No (clipped energy lost) |
| Inverter count | 1 hybrid inverter | 2+ separate inverters |
| Grid-forming capability | Requires hybrid inverter support | Battery inverter can be grid-forming |
For commercial buyers building from scratch, DC-coupling usually wins on lifetime economics. The ability to capture clipped energy alone can add 5–8% to annual revenue, per modeling from FFDPower’s 2025 system comparison. AC-coupling remains the pragmatic choice when adding storage to an existing 500 kW rooftop array where replacing the inverter would void warranties or disrupt operations.
A third option—multi-port hybrid inverters—has gained traction in 2026. These units accept PV input, battery input, generator input, and grid input simultaneously, with software-managed priority routing. For sites that need diesel backup as a tertiary power source, multi-port inverters eliminate the transfer switch and simplify control logic. The trade-off is higher per-kW inverter cost and reduced supplier pool, as only a handful of manufacturers currently offer true multi-port architectures at commercial scale.
The coupling decision also affects how the system qualifies for incentives. In the US, the IRA’s Investment Tax Credit applies differently to DC-coupled versus AC-coupled systems depending on whether the battery is charged exclusively from PV or from the grid. DC-coupled systems with dedicated PV-to-battery charging paths generally qualify more cleanly for the full 30% ITC plus energy community bonus. Consult a tax advisor before finalizing architecture—retrofitting an AC-coupled system to qualify for ITC can require expensive metering changes.
Sizing: The PV-to-Battery Ratio Question
There is no universal optimal ratio. The right PV-to-battery sizing depends on the rate structure, load profile, and revenue stack available at the project site. But industry convergence around certain benchmarks is visible.
For commercial peak-shaving applications, a battery sized at 30–50% of PV capacity (in kW) with 2–4 hours of duration covers most demand-charge scenarios. A 200 kW PV array paired with an 80 kWh cabinet energy storage unit can shift enough midday generation to shave afternoon peaks in markets where demand charges run $15–25/kW per month.
The MDPI research on large-scale PV+BESS plants found that BESS/PV capacity ratios around 20% represent a sweet spot for DC-coupled systems, where efficiency gains are maximized without overbuilding battery capacity that sits idle. Below 15%, the battery is too small to meaningfully shift generation. Above 35%, diminishing returns set in as the battery cannot fully charge from PV alone on low-irradiance days.
| Application | PV Size | Battery Size | Duration | BESS/PV Ratio |
|---|---|---|---|---|
| Small C&I peak shaving | 50–100 kW | 25–50 kWh | 2h | 30–50% |
| Mid-size commercial | 200–500 kW | 100–250 kWh | 2–3h | 25–40% |
| Large industrial | 1–2 MW | 500 kWh–1 MWh | 3–4h | 20–35% |
| Utility-scale hybrid | 5–20 MW | 2–8 MWh | 4h | 15–25% |
SMA Altenso, which operates over 4.5 GW of large-scale storage in development, deployed a PV+BESS hybrid plant at 25 MWp with integrated battery storage—a ratio that aligns with the 20% benchmark. ENGIE reports 5.6 GW of storage capacity in operation or under construction, much of it co-located with solar generation.
Sizing mistakes are expensive in both directions. An undersized battery fails to capture enough midday surplus to justify its cost—the fixed BMS and inverter overhead dominate a small system’s economics. An oversized battery sits partially charged most days, paying for capacity that the PV array cannot fill. The key variable is the daily energy surplus: how many kWh of excess solar generation does the site produce on a typical clear-sky day? The battery should be sized to capture 70–80% of that surplus, leaving margin for cloud variability and partial-discharge cycling that extends battery life.
Load profiling is the foundation of correct sizing. A manufacturing facility with a flat 200 kW demand profile from 6 AM to 10 PM needs a different battery configuration than a cold storage warehouse with intermittent 400 kW compressor spikes. The first benefits from 2-hour duration storage sized to shift midday PV into evening hours. The second needs high-power, short-duration storage (30–60 minutes) to shave demand peaks that drive demand charges. Some commercial sites need both—and a hybrid system can serve both functions if the EMS is configured correctly.
The Hybrid Inverter Market: $12.8 Billion and Accelerating
The hybrid inverter is the component that makes a hybrid solar system hybrid. It manages DC generation from panels, bidirectional DC flow to and from the battery, and AC output to the grid or load—all through one power conversion stage. MarkWide Research valued the solar storage hybrid inverter market at $12.8 billion in 2026, projecting expansion to $46.46 billion by 2035.
Market Research Future puts the CAGR at 8.9%. Persistence Market Research reports that three-phase hybrid inverters will command approximately 63.6% of the market in 2026—a reflection of commercial and utility demand overwhelming residential volumes. The three-phase dominance matters for buyers: it means supplier competition is concentrated in the commercial power class, driving down prices and improving feature sets.
Battery chemistry has effectively standardized. The IEA’s Global Energy Review 2026 notes that LFP batteries now account for roughly 90% of BESS deployments. NMC retains a niche in space-constrained applications where energy density matters more than cycle life, but for commercial hybrid solar systems where the battery cabinet sits in a parking lot or equipment room, LFP’s superior cycle life (6,000–8,000 cycles to 80% capacity) and thermal stability make it the default.
Rystad Energy’s 2026 white paper tracked global BESS capacity surpassing 250 GW by end of 2025, with over 100 GW/280 GWh added in that year alone. BESS has overtaken pumped hydro as the world’s largest energy storage source by installed capacity. The China Energy Storage Alliance projects 8–17× growth from the 166 GW baseline—a range that reflects uncertainty in policy and supply chains but confirms the direction.
LFP’s dominance rests on three pillars: cycle life, safety, and cost trajectory. A typical LFP cell delivers 6,000–8,000 equivalent full cycles before reaching 80% of nameplate capacity. NMC cells, by comparison, manage 3,000–5,000 cycles under similar duty profiles. For a commercial hybrid system cycling once daily, that translates to 16–22 years of LFP service versus 8–14 years for NMC—well beyond the typical 10-year warranty period.
Thermal stability matters more in commercial deployments where battery cabinets sit near occupied buildings. LFP’s cathode material decomposes at approximately 270°C, compared to NMC’s threshold near 210°C. The 60°C difference provides critical additional time for BMS thermal management to intervene before thermal runaway becomes uncontrollable. Insurance underwriters in Germany and the UK now require LFP chemistry for indoor or near-building battery installations—a de facto market mandate that further consolidates LFP’s position.
Revenue Stacks: How Hybrid Systems Earn Their Keep
A hybrid solar system generates revenue from multiple stacked streams. No single stream justifies the battery investment on its own. The combination does.
Self-consumption is the foundation. When a commercial facility consumes its own solar generation instead of purchasing from the grid at retail rates, the avoided cost is typically $0.12–0.28/kWh across European markets and $0.10–0.35/kWh in the US. A 10 kWp system with 14 kWh battery in a representative European commercial tariff structure can avoid approximately $1,135 in annual energy costs through self-consumption alone, according to modeling from GreenEnergyCalc’s 2026 toolset.
Battery arbitrage adds a second layer. Charging from excess solar during low-price midday hours and discharging during evening peak—when SolarPorts data shows prices can run 3× non-peak rates—generates roughly $645/year on the same 10 kWp + 14 kWh system. At commercial scale (500 kW PV + 200 kWh battery), arbitrage revenue scales to $15,000–30,000/year depending on the market’s peak-to-off-peak spread.
| Revenue Stream | Mechanism | Typical Value ($/kWh-yr) | Availability |
|---|---|---|---|
| Self-consumption | Avoided retail purchase | $80–150 | Universal |
| Time-of-use arbitrage | Charge low, discharge peak | $40–90 | Markets with TOU tariffs |
| Demand charge reduction | Peak kW shaving | $30–70 | US, parts of Asia |
| Ancillary services | Frequency regulation, reserves | $15–50 | Grid operator dependent |
| Capacity payments | Available kW commitment | $20–60 | Capacity markets (UK, PJM) |
The stacking potential varies by market. In the UK, a hybrid system can earn from self-consumption, arbitrage, and Dynamic Containment ancillary services simultaneously. In Germany, the focus shifts to self-consumption and negative-price avoidance. SolarPower Europe released two technical due diligence reports in February 2026 specifically for utility-scale hybrid PV+BESS projects, signaling that financing institutions now treat hybrid as a bankable asset class requiring standardized assessment frameworks.
Intersolar Europe 2025 made PV+BESS hybrid business models a central theme, with sessions focused on how co-located systems unlock new revenue mechanisms unavailable to standalone assets. The consensus among project developers: hybrid systems achieve 20–35% higher internal rates of return than standalone PV at current European tariff structures.
Degradation, Warranties, and the 10-Year TCO Question
Total cost of ownership over a 10-year horizon determines whether a hybrid solar system delivers on its financial promise. The battery is the wildcard—unlike panels and inverters, batteries degrade visibly, and the rate of degradation shapes the system’s revenue trajectory year over year.
LFP cells lose approximately 2–3% of capacity in the first year, then 1.5–2% annually thereafter under typical commercial cycling (one full cycle per day, 20–80% depth of discharge). By year 10, a well-managed LFP battery retains 70–78% of its original capacity. The warranty should reflect this curve—not a flat “80% at year 10” guarantee that the supplier cannot mathematically honor.
Depth of discharge management is the single most impactful variable under buyer control. Cycling between 20% and 80% state of charge (60% usable range) can double cycle life compared to 0–100% cycling. A sophisticated EMS enforces these bounds automatically. A basic system that allows full discharge until the BMS intervenes will burn through warranty cycles rapidly and accelerate capacity fade.
Inverter replacement is the second TCO factor. Hybrid inverters carry 5–10 year warranties, meaning at least one replacement is likely during a 15-year project life. Budget $0.05–0.08/W for inverter replacement at year 7–8. For a 500 kW system, that is $25,000–40,000 in deferred capex that should appear in the financial model—not as a surprise.
O&M costs for hybrid systems run $15–25/kW-year, covering EMS monitoring, quarterly inspections, firmware updates, and performance reporting. This is 30–50% higher than standalone PV O&M ($10–15/kW-year) because the battery and hybrid inverter add complexity. The additional O&M cost is typically recovered within the first year through revenue gains from optimized dispatch.
What Commercial Buyers Should Demand From Suppliers
Specifying a hybrid solar system requires more technical diligence than buying panels and an inverter separately. The integration complexity is where projects fail and where supplier selection becomes critical.
Ask for round-trip efficiency data measured at the system level, not the battery cell level. A supplier quoting 95% cell efficiency while the integrated system delivers 88% after inverter and BMS losses is masking the number that matters. Request performance curves across partial load conditions—hybrid systems frequently operate at 20–60% of rated power, where efficiency characteristics diverge significantly from nameplate ratings.
Warranty terms reveal supplier confidence. LFP battery warranties should specify capacity retention at year 10 (target: ≥70% of nameplate) and cycle count (target: ≥6,000 equivalent full cycles). Hybrid inverter warranties should cover both the PV and battery power electronics under a single document, with clear escalation paths when a fault in one subsystem affects the other.
Software capability separates adequate systems from excellent ones. The EMS should support time-of-use scheduling, demand-charge forecasting, and remote firmware updates. It should expose an API for integrating with building management systems or SCADA. If the supplier cannot demonstrate the EMS interface in a live demo, walk away.
| Evaluation Criterion | What to Ask | Red Flag |
|---|---|---|
| System-level efficiency | AC-to-AC round-trip at 50% load | Only cell-level data provided |
| Battery warranty | Capacity retention at year 10 and cycle count | “10-year warranty” with no retention guarantee |
| Hybrid inverter | Single unit managing PV + battery, or separate? | Two inverters marketed as “hybrid” |
| EMS software | TOU scheduling, API access, remote updates | Closed system, no API, manual scheduling only |
| Grid-forming capability | Can the system island and black-start? | Grid-following only, no island mode |
| Compliance | IEC 62477, IEEE 1547, G99, VDE-AR-N 4110 | “Meets local standards” without certification numbers |
Compliance matters more than most buyers realize. The EU’s revised Network Code requirements, Germany’s VDE-AR-N 4110, the UK’s G99, and IEEE 1547 in the US all impose specific requirements on hybrid systems that differ from standalone PV or standalone storage. A system that passes PV interconnection may fail hybrid interconnection because the battery inverter introduces grid-forming or stability requirements that the PV inverter alone never triggered.
Cybersecurity is an emerging evaluation criterion. A hybrid system with cloud-connected EMS is an IoT device on your facility’s network. Ask whether the EMS supports role-based access control, encrypted communication (TLS 1.3), and audit logging. The IEC 62443 standard for industrial automation security applies increasingly to energy storage controllers. Suppliers that dismiss cybersecurity questions are suppliers that have not thought through the threat model.
Spare parts availability is the procurement question that nobody asks until the system is down. A hybrid inverter failure during peak solar season can cost $200–500 per day in lost self-consumption revenue for a mid-size commercial system. Confirm that critical spare parts (power modules, control boards, BMS units) are stocked regionally and can ship within 48 hours. A supplier with a European warehouse and 24-hour dispatch capability is worth a 5–10% price premium over one that ships from Shenzhen with 2-week lead times.
Market Reality: Where Hybrid Systems Are Being Deployed Now
The Lazard LCOE 2025 report put utility-scale solar plus storage as low as $20/MWh with IRA tax credits in the US. That number makes hybrid systems the cheapest dispatchable renewable resource in many markets—not the cheapest intermittent resource, but the cheapest one that can be scheduled.
Egypt’s Aswan project—a 1 GW solar facility paired with 600 MWh of battery storage—demonstrates the utility-scale hybrid model in emerging markets. The combination addresses both generation and dispatchability needs without requiring additional transmission for a standalone battery. Similar projects are advancing across Southeast Asia and the Middle East, where peak demand hours align with evening solar decline.
For commercial buyers, the decision framework is simpler. If your facility pays demand charges above $10/kW per month, has a retail tariff with meaningful peak-to-off-peak spread, or operates in a market with negative midday prices, a hybrid solar system will almost certainly outperform standalone PV on 10-year NPV. The question is not whether to add storage, but how much and what architecture.
Southeast Asia is emerging as a high-growth region for commercial hybrid deployment. Vietnam’s feed-in tariff expiration pushed commercial solar owners toward self-consumption models that require storage to be viable. Thailand’s PDP 2024 plan explicitly incentivizes hybrid renewable projects. Indonesia’s archipelago geography creates natural demand for solar-plus-storage in off-grid and weak-grid applications. These markets are importing Chinese-manufactured LFP battery cabinets and hybrid inverters at prices 20–30% below 2024 levels.
In Africa, the hybrid model serves a different need. Countries like Kenya, Nigeria, and South Africa face chronic grid instability—diesel generators have been the default backup. A hybrid solar system with grid-forming capability replaces diesel at a fraction of the operating cost. Diesel hybrid payback runs 3–6 years in markets where diesel costs $0.25–0.40/kWh and solar-plus-storage LCOE is $0.08–0.12/kWh. The search data from our own Google Ads campaigns confirms this shift—queries for “solar solutions Kenya” and “hybrid solar setup” appear with increasing frequency and click-through rates above 15%.
Module prices at $0.10/W mean the PV side of a hybrid system is cheaper than it has ever been. Battery cell prices at $84/kWh (BloombergNEF Q1 2026) mean the storage side is approaching the threshold where even single-revenue-stream economics pencil out. The hybrid inverter market at $12.8 billion means supplier competition is intense enough to give buyers leverage on price, warranty terms, and software capabilities.
The standalone solar era is ending. Not because solar failed—it succeeded so thoroughly that it broke its own economics. Hybrid systems are the fix.
Frequently Asked Questions
What size battery do I need for a hybrid solar system?
Size the battery at 20–50% of PV capacity (kW) with 2–4 hours duration for most commercial peak-shaving applications. Match sizing to your tariff structure and load profile.
Is DC-coupled or AC-coupled better for commercial projects?
DC-coupled is typically better for new builds—higher efficiency and clipping recovery. AC-coupled is preferred for retrofitting storage onto existing PV installations.
How long do hybrid solar system batteries last?
LFP batteries deliver 6,000–8,000 cycles to 80% capacity, translating to 10–15 years in typical commercial duty cycles. Warranty should guarantee 70% retention at year 10.
Can a hybrid solar system work off-grid?
Yes, if the hybrid inverter supports grid-forming mode. The system can island during outages or operate fully off-grid with sufficient battery capacity for multi-day autonomy.
What is the payback period for a commercial hybrid solar system?
Typically 4–7 years with stacked revenue streams (self-consumption, arbitrage, demand charge reduction). Standalone PV payback is faster but total 10-year revenue is lower.
If you are evaluating a hybrid solar system for a commercial or industrial project, our engineering team can help you compare DC-coupled versus AC-coupled architectures, size the battery for your specific tariff structure, and navigate interconnection compliance. Request a Consultation
This article is for informational purposes only and does not constitute engineering or financial advice. System specifications, costs, and revenue figures vary by location and project conditions.