
 chinahuijue@gmail.com
 +1 (702) 204-9855
Solar Battery Storage Systems: What Commercial Buyers Need to Know in 2026
LFP cell prices hit $84/kWh in Q1 2026, down 27% from early 2023. That number gets quoted a lot. What gets quoted less often is that a fully installed commercial solar battery storage system still costs $280–$560/kWh — three to six times the cell price. The gap between cell-level headlines and system-level reality is where most buyers lose money.
The math has shifted enough that solar-plus-storage is now cheaper than running diesel generators in most of Africa and the Middle East. SolarPower Europe, modeling with Rystad Energy, found that co-located PV-plus-battery projects capture 73% higher prices than standalone solar. The question for commercial buyers is no longer whether to add batteries, but how to size them, spec them, and avoid the balance-of-system costs that quietly inflate the final invoice.
This guide covers what has actually changed in 2026, how to read a system quote without being misled by cell prices, and what to ask suppliers before signing. For buyers evaluating containerized solar battery storage, the engineering decisions matter more than the brand name on the cabinet.
Cell Prices Fell 27% — System Prices Barely Moved
BloombergNEF’s April 2026 battery price survey put LFP cell prices at $84/kWh globally, with Chinese tier-1 suppliers transacting at $75–78/kWh in bulk. CATL, BYD, and Gotion have all guided sub-$80/kWh pricing for H2 2026 orders. BNEF now expects the average to reach $70/kWh by end of 2027 — two years ahead of their previous trajectory.
But cell prices are roughly 35–50% of a utility-scale system’s total cost. The other 50–65% — PCS, EMS, thermal management, fire suppression, civil works, grid connection, EPC management — has not fallen at the same rate. A SOLARTODO analysis of 2026 procurement data found that non-cell balance-of-system costs typically run $40–$120/kWh depending on region, compliance requirements, and site conditions.
This is why a $84/kWh cell does not produce a $150/kWh system. The cell-to-system multiplier sits at 2.7–3.0x for utility-scale projects and 3.5–5.5x for commercial and industrial (C&I) installations, where smaller volumes and site-specific engineering eat into economies of scale.
| System Type | Duration | 2026 Installed Cost ($/kWh) | Typical Power Range |
|---|---|---|---|
| Utility-scale BESS | 2-hour | $210–$320 | 10–200 MW |
| Utility-scale BESS | 4-hour | $260–$390 | 10–300 MW |
| C&I solar battery storage | 2-hour | $280–$480 | 250 kW–10 MW |
| C&I solar battery storage | 4-hour | $340–$560 | 250 kW–20 MW |
Source: SOLARTODO 2026 BESS pricing benchmarks, based on BNEF, NREL, and IEA data. Costs vary by region, EPC scope, and compliance requirements.
The Cost Stack: Where Your Money Actually Goes
A 2026 C&I solar battery storage project breaks down roughly as follows: cells, modules, and racking account for 40–55% of CAPEX. The power conversion system (PCS) and medium-voltage equipment add another 10–18%. EMS, SCADA, and controls run 4–10%. Thermal management — increasingly liquid-cooled in larger systems — takes 4–9%. Fire suppression and safety systems, driven by NFPA 855 and local equivalents, consume 4–8%.
The remaining 8–20% goes to civil works, installation, commissioning, permitting, and EPC contingency. This is the line item that catches buyers off guard. A factory in Vietnam and a factory in Germany may buy the same cells at the same price, but the German installation could cost $80–$120/kWh more once CE compliance, fire codes, and labor rates are factored in.
Wood Mackenzie noted in 2024 that systems integrator competition is compressing margins in mature markets. That helps, but only at the equipment level. Site-specific costs — grid connection studies, transformer upgrades, environmental permits — are immune to supplier competition. Buyers who compare quotes on cell price alone will miss 40–60% of the actual project cost.
Sizing Solar Battery Storage: From 100 kWh to 1 MWh
The most common sizing question in 2026 is not “how big should my battery be” but “how many hours of storage do I need.” One-hour systems suit frequency regulation and fast-response services. Two to four hours covers peak shaving, time-of-use arbitrage, and solar self-consumption. Four hours is becoming the default for utility tenders and is increasingly mandated in markets with solar penetration above 20–30%.
For C&I buyers, the sizing decision should start with the load profile, not the battery catalog. A factory running two shifts with a 500 kW peak demand and 15% spare transformer capacity needs a different system than a telecom site with 50 kW continuous load and 8 hours of daily grid outage. The first might need a 250 kWh cabinet for demand charge management. The second needs 400 kWh of deep-cycle storage with hybrid inverter integration.
| Application | Typical System Size | Primary Value Stream | Typical Payback |
|---|---|---|---|
| Demand charge management | 250 kW–5 MW / 500 kWh–20 MWh | Peak shaving, TOU arbitrage | 5–8 years |
| EV charging buffer | 500 kW–5 MW / 1–10 MWh | Avoid grid upgrade, demand smoothing | 4–7 years |
| Off-grid diesel hybrid | 100 kW–10 MW / 200 kWh–40 MWh | Diesel displacement, reduced maintenance | 3–6 years |
| Solar self-consumption | 100 kW–5 MW / 200 kWh–20 MWh | Shift excess solar to evening peak | 5–9 years |
Source: SOLARTODO 2026 procurement benchmarks. Payback periods assume LFP chemistry, 90% depth of discharge, and at least two stacked revenue streams.
DC Coupling vs AC Coupling: An Engineering Decision With Real ROI Impact
One of the first engineering decisions in a solar-plus-storage project is whether to DC-couple or AC-couple the battery with the solar array. The choice affects efficiency, cost, and revenue potential — and it is frequently glossed over in supplier proposals.
DC coupling connects the battery directly to the solar array’s DC bus, before the inverter. This eliminates one DC-to-AC conversion step, improving round-trip efficiency by 5–8% compared to AC coupling. The trade-off is that DC-coupled systems require a hybrid inverter and more complex control architecture. They also make it harder to retrofit batteries onto an existing solar installation, since the existing inverter may not support DC battery input.
AC coupling keeps the solar and battery systems electrically separate. The solar array feeds through its own inverter to the AC bus, and the battery connects through a separate bidirectional PCS. This is simpler, more modular, and easier to expand. The efficiency penalty — that extra conversion step — costs roughly 3–5% of stored energy on each cycle.
For new-build projects where solar and storage are deployed simultaneously, DC coupling is usually the better choice. The efficiency gain compounds over thousands of cycles and the hybrid inverter cost premium (typically $15–30/kW) pays back within 2–3 years. For retrofit projects adding storage to an existing solar installation, AC coupling is often the only practical option without replacing the solar inverter entirely.
The solar storage hybrid inverter market reflects this convergence. MarkWide Research values the segment at $12.8 billion in 2026, projected to reach $46.5 billion by 2035. Manufacturers including Sungrow, Huawei, and GoodWe now offer hybrid inverters that support flexible configurations — grid-tied, off-grid, or hybrid — within a single unit, which simplifies procurement for buyers who may need to change operating modes over the system’s lifetime.
What 100 kWh, 200 kWh, and 1 MW Actually Cost
System-level pricing benchmarks are useful, but commercial buyers usually need to know what their specific capacity requirement will cost. The following estimates are based on Q1–Q2 2026 procurement data for LFP systems with standard BOS, excluding grid connection upgrades and special permitting.
| System Size | Typical Application | FOB Price (CNY) | EPC Turnkey (Asia) | EPC Turnkey (EU) |
|---|---|---|---|---|
| 100 kWh / 50 kW | Small C&I, telecom | ¥180,000–250,000 | ¥240,000–340,000 | €31,000–48,000 |
| 200 kWh / 100 kW | Medium C&I, peak shaving | ¥320,000–450,000 | ¥420,000–580,000 | €55,000–82,000 |
| 500 kWh / 250 kW | Factory, EV charging | ¥750,000–1,050,000 | ¥980,000–1,400,000 | €130,000–195,000 |
| 1 MWh / 500 kW | Industrial, microgrid | ¥1,400,000–1,900,000 | ¥1,850,000–2,600,000 | €245,000–365,000 |
Source: 2026 supplier quotes compiled from industry procurement data. FOB prices reflect Chinese factory-gate pricing for standard LFP cabinet systems. EPC turnkey includes installation, commissioning, and basic grid connection. Actual costs vary by site conditions, compliance requirements, and project complexity.
The unit cost drops significantly as system size increases. A 100 kWh system might cost ¥2,400–3,400/kWh at the EPC level in Asia, while a 1 MWh system comes in at ¥1,850–2,600/kWh. This economy of scale is driven by fixed costs — grid connection studies, permitting, transportation, and commissioning labor — that spread across more capacity. Buyers considering phased deployment should weigh the cost penalty of buying small now versus the financial risk of committing to a larger system before validating the business case.
Solar-Plus-Storage: The 73% Capture Price Gap
The strongest economic argument for adding battery storage to a solar installation is not backup power. It is capture price. SolarPower Europe’s “Solar+” report, modeled by Rystad Energy, found that co-located PV-plus-battery projects capture 73% higher prices than standalone solar. The reason is simple: solar peaks at midday when prices are lowest. Batteries shift that energy to evening hours when demand — and prices — peak.
IRENA data puts the levelized cost of electricity (LCOE) for solar-plus-storage at $54–82/MWh in regions with good solar resources. That is competitive with combined-cycle gas in most markets and cheaper than diesel in virtually all of them. The Aswan project in Egypt — 1,000 MW solar plus 600 MWh of storage, commissioned in June 2026 at a cost of $700 million — is the largest single-site solar-plus-storage installation in Africa and a working proof that the economics work at scale.
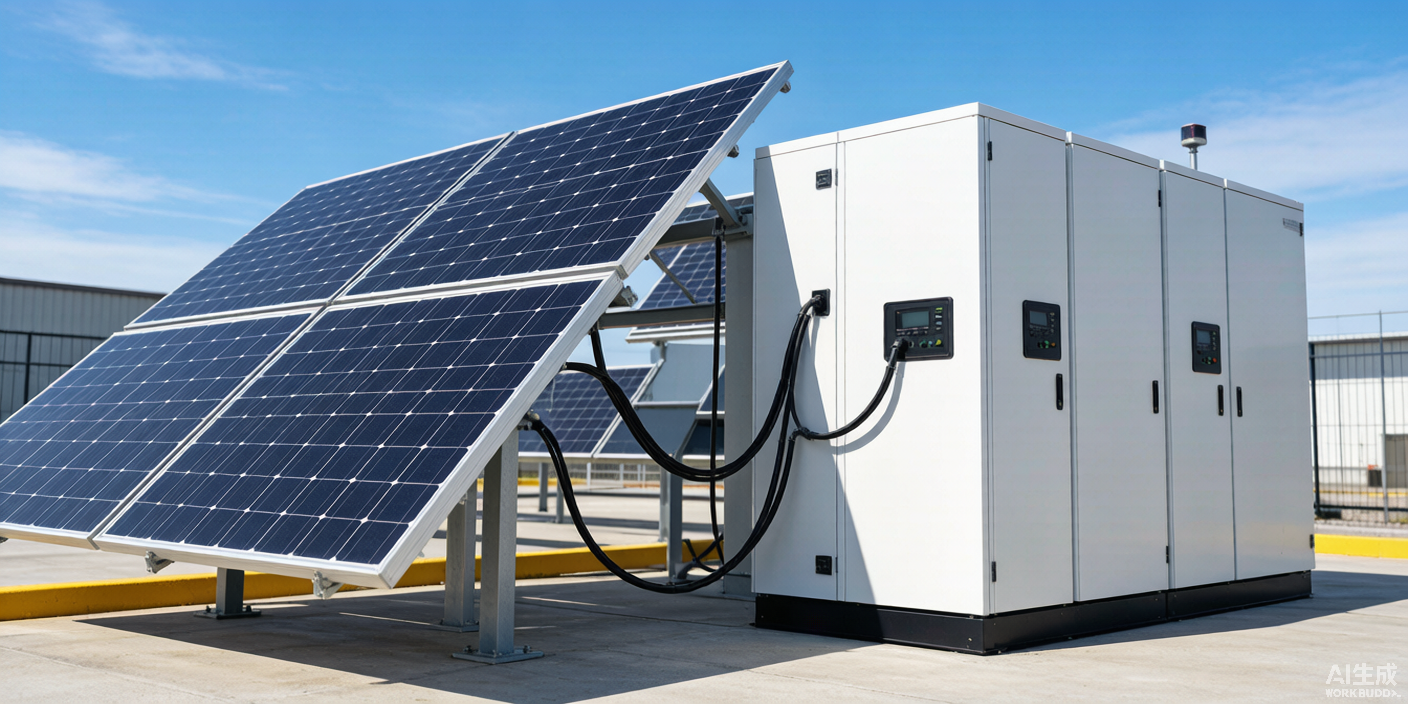
For commercial buyers, the implication is direct. A solar battery storage cabinet paired with rooftop or ground-mount PV can cut grid energy purchases by 40–70% depending on load profile and tariff structure. The battery does not need to cover the entire load — it needs to cover the gap between solar generation and consumption during peak-rate hours.
LFP Dominance: Why Chemistry Choice Is Mostly Settled
The chemistry debate that dominated 2022–2024 industry conferences is largely over. LFP won. BloombergNEF’s 2026 data shows LFP cells at $84/kWh versus $110/kWh for NMC — a $26/kWh gap that, combined with LFP’s superior safety profile and longer cycle life, makes NMC difficult to justify for stationary storage.
LFP batteries deliver 6,000+ cycles at 90% depth of discharge with round-trip efficiency above 90%. The thermal runaway risk is meaningfully lower than NMC, which simplifies permitting and reduces fire suppression costs. Fraunhofer ISE, in its 2024 analysis, called battery storage “the core technology for integrating variable renewable power” — and the industry has standardized on LFP for that role.
Sodium-ion, at $95–105/kWh in early 2026, is not yet competitive with LFP on price but could find niches in cold-climate deployments where LFP’s low-temperature performance is a limitation. Solid-state batteries remain a 2028+ story for stationary storage. For buyers signing contracts in 2026, LFP is the rational default.
Regional Cost Differences: Why Location Matters More Than Brand
The same LFP cells, assembled into the same cabinet design, produce dramatically different installed costs depending on where the project sits. Chinese domestic installations benefit from proximity to cell manufacturing, low logistics costs, and streamlined permitting — utility-scale 4-hour systems install at $150–175/kWh. In the European Union, CE compliance, fire safety regulations, and higher labor rates push the same system to $240–280/kWh. US projects face the highest costs at $280–350+/kWh, driven by tariff exposure, domestic content requirements, and grid interconnection backlogs.
The Middle East and North Africa region sits between these extremes at $200–230/kWh for utility-scale, but the economics there are uniquely favorable because the alternative — diesel generation — is expensive enough that payback periods compress to 3–6 years. DNV projects MENA solar capacity will double to 154 GW by end of 2026 and double again to 343 GW by 2029.
| Region | Utility 2h ($/kWh) | C&I 2h ($/kWh) | Key Cost Driver |
|---|---|---|---|
| Asia-Pacific | $210–$290 | $280–$420 | Manufacturing proximity, low logistics |
| European Union | $250–$320 | $330–$480 | CE compliance, fire codes, labor |
| North America | $260–$340 | $340–$500 | Tariffs, domestic content, interconnection |
| Middle East / Africa | $230–$330 | $300–$470 | Logistics, ambient temperature, customs |
Source: SOLARTODO 2026 regional pricing analysis. Note: an EU inverter restriction effective May 2026 prohibits EU-funded projects from using Chinese-made inverters and PCS, which may further increase European system costs.
What to Ask Before Signing: Degradation, Warranties, Augmentation
The single most overlooked cost in solar battery storage procurement is degradation. LFP batteries lose 15–25% of usable capacity by year 10 in daily cycling applications, assuming no planned augmentation. That means a 500 kWh system in year 1 delivers 375–425 kWh in year 10. If the business case depends on maintaining 500 kWh through year 10, the buyer needs to budget for augmentation — adding cells in year 6 or 7 — or oversize the initial installation by 15–20%.
Warranty terms separate serious suppliers from commodity sellers. A 10-year performance warranty with 95–98% availability guarantee is the industry standard for bankable projects. Buyers should specifically request the degradation curve — not just the end-of-warranty capacity threshold — and the augmentation plan. If the supplier cannot provide a year-by-year capacity projection, that is a signal to walk away.
Payment terms and FOB versus EPC pricing also matter. FOB (free on board) pricing covers equipment at the factory gate. CIF (cost, insurance, freight) adds shipping. EPC turnkey includes installation, commissioning, and grid connection. Comparing an FOB quote from one supplier with an EPC quote from another is the most common — and most expensive — procurement mistake in this market. Standard payment terms run 30% T/T advance with 70% against bill of lading, or 100% letter of credit at sight.
The EU Inverter Restriction: What Changes for European Buyers
Effective May 1, 2026, the European Union prohibited EU-funded projects — including those backed by the European Investment Bank and European Investment Fund — from using inverters and power conversion systems manufactured in China, Russia, Iran, or North Korea. The rule applies to new projects only, not retroactively, but it reshapes procurement strategy for any European buyer relying on EU grants or green financing.
The practical effect is that European projects now need to source PCS and inverters from non-Chinese manufacturers — Sungrow’s European factory, SMA Solar, Power Electronics, or Fronius — while battery cells and cabinets can still originate from China. This splits the supply chain and adds cost. European-made inverters typically run 20–40% more than Chinese equivalents, and lead times can stretch to 6–9 months versus 4–8 weeks for Chinese supply.
For private buyers not using EU funding, the restriction does not apply directly. But it creates a two-tier market where EU-funded projects absorb the premium tier of non-Chinese inverter supply, potentially pushing private buyers toward longer wait times or Chinese alternatives that cannot be used in co-located publicly-funded projects. Co-located solar-plus-storage projects in Europe already account for over 60% of shared-site facilities, with Germany, the UK, and Bulgaria identified as the most attractive markets.
Software and EMS: The Hidden Value Lever
Hardware gets most of the attention in battery storage procurement. Software determines whether the system actually makes money. SOLARTODO’s 2026 analysis found that dispatch optimization — the EMS software that decides when to charge, when to discharge, and which revenue stream to prioritize — can improve annual revenue by 3–8% in commercial and mixed-market applications.
That margin matters. A 500 kWh system generating ¥80,000 in annual savings with basic scheduling might generate ¥84,000–86,000 with intelligent dispatch. Over a 10-year operating period, the software premium (typically ¥15,000–40,000 for a mid-tier EMS) pays for itself within the first 18 months.
The best EMS platforms in 2026 do three things: they forecast solar generation and load using weather data and historical patterns, they optimize across multiple revenue streams simultaneously (demand charge reduction, TOU arbitrage, frequency response), and they provide remote monitoring with automated alerts for abnormal performance. Buyers should evaluate the EMS as carefully as the battery cells — a well-designed cabinet with a poorly-tuned EMS will underperform a mediocre cabinet with intelligent dispatch.
S&P Global Commodity Insights noted in 2024 that grid operators increasingly value long-duration flexibility over raw power capacity. This means EMS platforms that can participate in grid services markets — automatically bidding into frequency regulation or capacity markets when prices are favorable — generate an additional revenue layer that standalone peak-shaving systems cannot access.
Temperature and Environment: The Performance Factor Nobody Quotes
Every LFP battery datasheet lists performance at 25°C. Very few commercial installations operate at a constant 25°C. In the Middle East, where ambient temperatures regularly exceed 45°C in summer, battery cabinets need active liquid cooling to maintain safe operating temperatures. In northern Europe or high-altitude sites in Africa, winter temperatures below 0°C reduce LFP charging efficiency and can trigger low-temperature protection circuits that prevent charging entirely until the cells warm up.
The cost of thermal management scales with the temperature gap. A system deployed in Dubai might spend 6–9% of CAPEX on HVAC and liquid cooling, compared to 3–5% for the same system in a temperate climate. More importantly, high operating temperatures accelerate degradation. An LFP battery cycling daily at 40°C internal temperature may degrade 30–40% faster than the same battery at 25°C, shortening the effective warranty period and requiring earlier augmentation.
Buyers in hot climates should specifically request high-temperature performance data and verify that the supplier’s warranty terms account for elevated ambient conditions. Some suppliers offer extended-temperature LFP variants with modified electrolyte chemistry that maintain cycle life at 40–45°C, though these carry a 5–10% price premium. For cold-climate deployments, sodium-ion chemistry — while not yet cost-competitive on a $/kWh basis — offers genuine advantages at temperatures where LFP requires heating elements to charge safely.
Real-World Buyer Scenarios
Consider three common buyer profiles that illustrate how sizing, chemistry, and architecture decisions diverge based on application.
A textile factory in Bangladesh with a 1.2 MW peak load, 18-hour daily operation, and frequent grid outages of 2–4 hours needs a hybrid system. The optimal configuration pairs 800 kW of rooftop solar with a 600 kWh LFP battery cabinet and a diesel generator for multi-day backup. The battery handles daily peak shaving and short outages. The generator only runs during extended grid failures. Expected payback: 4–5 years, driven primarily by diesel fuel savings and reduced demand charges.
A telecommunications tower in rural Nigeria with 15 kW continuous load and 8–12 hours of daily grid outage needs reliability, not arbitrage. A 120 kWh LFP cabinet with hybrid inverter and small solar array (30 kW) can eliminate diesel consumption entirely. The system charges from solar during the day and from grid during available hours, discharging during outages. Payback runs 3–4 years given diesel costs of $1.20–1.80/liter in remote locations.
A commercial building in Germany with 300 kW peak demand, rooftop solar already installed, and a time-of-use tariff with a 3:1 peak-to-off-peak ratio needs an AC-coupled retrofit. A 250 kWh battery connected through a bidirectional PCS charges from excess solar at midday and discharges during the 5–9 PM peak rate window. The system does not provide backup power — that would require islanding capability — but the TOU arbitrage alone delivers a 6–8 year payback, and the 73% capture price improvement identified by SolarPower Europe applies directly.
The Market in Numbers
Global BESS deployment grew 57% year-over-year in 2026, according to InfoLink Consulting. Battery cell shipments reached 612 GWh in 2025 and are forecast at 801 GWh for 2026. The BESS market size expanded from $68.7 billion to $83.9 billion. Solar storage hybrid inverter shipments, valued at $12.8 billion in 2026, are projected to reach $46.5 billion by 2035.
Three forces drive this growth. Grid stability requirements in markets with renewable penetration above 20% create mandatory storage demand. AI data centers — absent from demand forecasts three years ago — will account for 20% of all BESS installations by 2030. And the shift from build-first to use-first, particularly in China where standalone storage now represents 84.7% of new BESS capacity, means buyers are prioritizing utilization rates over raw capacity.
The supply side tells a different story. Chinese cell manufacturing capacity stands at approximately 2,100 GWh against global demand of 1,500 GWh. That structural oversupply keeps prices low — for now. Ember, in its December 2025 analysis, noted that all-in BESS project costs had fallen to $125/kWh. If lithium prices rebound from the current $13,000–17,000/ton to above $30,000/ton, cell prices could reverse. The article’s guidance: do not delay procurement chasing the absolute bottom, but lock in pricing with forward contracts when possible.
Frequently Asked Questions
How much does a commercial solar battery storage system cost in 2026?
C&I systems range from $280–$560/kWh installed, depending on duration, region, and EPC scope. Utility-scale projects run $210–$390/kWh.
What size solar battery do I need for my business?
Start with your load profile. Most C&I applications need 2–4 hours of storage at peak demand. A 500 kW peak typically requires 250 kWh–1 MWh of battery capacity.
Is LFP or NMC better for solar battery storage?
LFP. It costs $26/kWh less, offers 6,000+ cycles, superior safety, and dominates stationary storage. NMC only makes sense for space-constrained applications.
How long do solar battery storage systems last?
LFP systems retain 75–85% of original capacity after 10 years of daily cycling. Plan for augmentation at year 6–7 to maintain rated capacity.
Can solar battery storage replace diesel generators entirely?
In most off-grid and hybrid scenarios, yes. Diesel hybrid payback runs 3–6 years. Full replacement requires oversized battery capacity for multi-day autonomy.
If you are evaluating solar battery storage for a commercial or industrial project, our engineering team can help you size the system correctly, compare FOB versus EPC pricing, and navigate regional compliance requirements. Request a Consultation
Cost data in this article reflects Q1–Q2 2026 market conditions and is sourced from BloombergNEF, IRENA, SolarPower Europe, InfoLink Consulting, and SOLARTODO. Actual project costs vary by site, scope, and supplier.