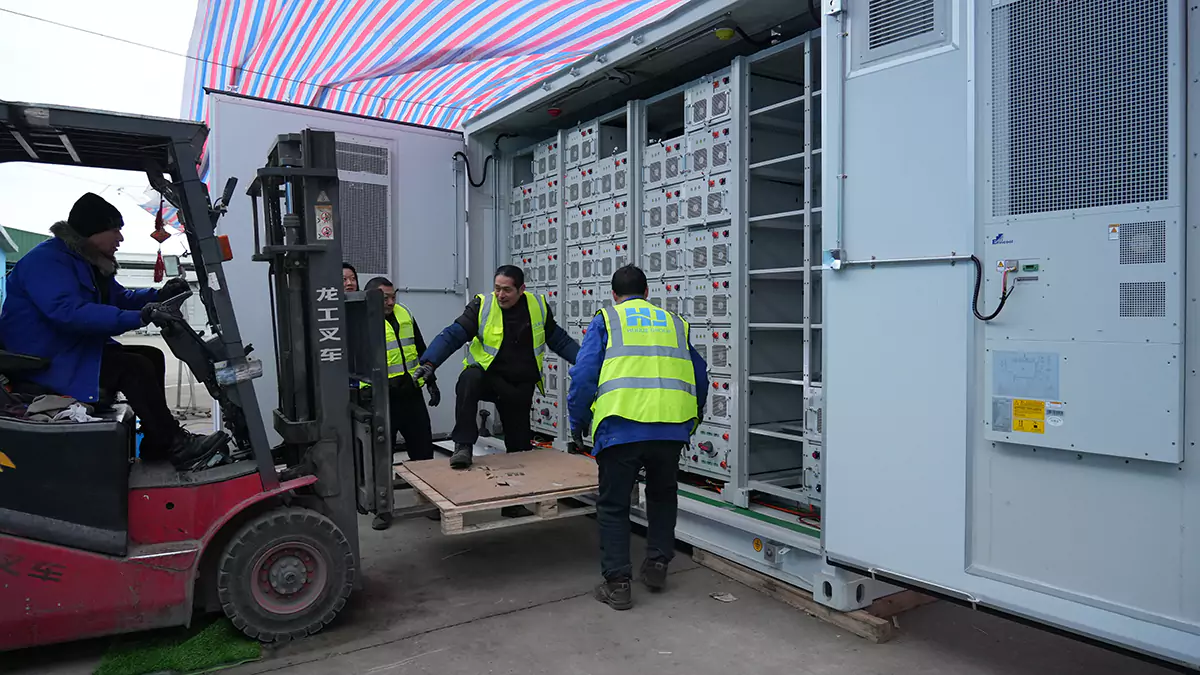
The global energy storage industry has exploded from a niche technology to a $120+ billion market in just five years. But beneath the headline growth numbers lies a far more complex reality—oversupply, price wars, technology monoculture risk, and policy dependency. This deep analysis separates genuine opportunities from speculative hype, providing investors, manufacturers, and project developers with the strategic intelligence needed to navigate the industry’s transition from “gold rush” to “deep-water zone.”
Quick Answer: Energy Storage Market at a Glance (2026)
| Metric |
2024 |
2025 (Proj.) |
2026 (Proj.) |
Trend |
| Global New Installations (GWh) |
187 |
250 |
340 |
↗ Slowing growth |
| YoY Growth Rate |
92% |
33% |
36% |
→ Stabilizing |
| China Installed Capacity (GWh) |
45 |
68 |
95 |
↗ Still leading |
| Global Market Value ($B) |
88 |
112 |
138 |
↗ Growing |
| LFP Cell Price ($/kWh) |
95 |
82 |
75 |
↘ Approaching floor |
| Announced Capacity (GWh) |
900+ |
1,200+ |
1,500+ |
⚠️ Oversupply risk |
| Lithium-ion Market Share |
96% |
94% |
92% |
↘ Slowly diversifying |
| Non-Lithium Market Share |
4% |
6% |
8% |
↗ Emerging |
Energy storage cabinet systems represent one of the fastest-growing segments, but the broader industry faces structural challenges that demand careful strategic navigation.
1. Rapid Growth with Hidden Risks
1.1 The Boom in Numbers
The energy storage market is undeniably booming—but the nature of that boom is changing. Understanding the difference between absolute growth and growth rate deceleration is critical for investment decisions.
| Year |
Global New Installations (GWh) |
YoY Growth |
Cumulative (GWh) |
Key Driver |
| 2022 |
45 |
— |
75 |
Policy subsidies launch |
| 2023 |
97 |
115% |
172 |
Renewable mandate expansion |
| 2024 |
187 |
92% |
359 |
Solar+storage boom |
| 2025 (Proj.) |
250 |
33% |
609 |
Grid-scale deployment |
| 2026 (Proj.) |
340 |
36% |
949 |
Commercial/industrial surge |
| 2027 (Proj.) |
430 |
26% |
1,379 |
Stable growth phase |
| 2030 (Proj.) |
800 |
12% CAGR |
3,500+ |
Mature market |
Key Insight: Growth rates are decelerating from 92% (2024) to 33% (2025) to a projected 12% CAGR by 2030. The industry is transitioning from a “boom phase” to a “stable growth phase”—still expanding, but no longer doubling year-over-year.
1.2 Regional Growth Distribution
| Region |
2024 Installations (GWh) |
2026 Proj. (GWh) |
Growth |
Key Market Driver |
| China |
45 |
95 |
111% |
Mandatory storage policy for renewables |
| United States |
38 |
72 |
89% |
IRA tax credits (30% ITC) |
| Europe |
22 |
48 |
118% |
Energy security + REPowerEU |
| Australia |
15 |
28 |
87% |
Residential solar+storage |
| Japan/Korea |
12 |
20 |
67% |
Grid resilience programs |
| Middle East/Africa |
8 |
18 |
125% |
Off-grid + microgrid demand |
| Southeast Asia |
6 |
14 |
133% |
Island microgrids + solar |
| Latin America |
4 |
9 |
125% |
Renewable integration |
| India |
3 |
8 |
167% |
PLI scheme + grid modernization |
1.3 The Oversupply Crisis
More critically, supply-side expansion is dramatically outpacing demand. Since 2023, announced capacity expansion plans by storage manufacturers have exceeded 900 GWh, with total investments surpassing ¥471.7 billion ($65 billion). This oversupply has triggered cutthroat price competition.
| Supply-Demand Balance |
2024 |
2025 (Proj.) |
2026 (Proj.) |
2027 (Proj.) |
| Global Demand (GWh) |
187 |
250 |
340 |
430 |
| Announced Capacity (GWh) |
900 |
1,200 |
1,500 |
1,800 |
| Utilization Rate |
21% |
21% |
23% |
24% |
| Actual Production (GWh) |
280 |
350 |
420 |
500 |
| Effective Oversupply Ratio |
1.5x |
1.4x |
1.24x |
1.16x |
| Cell Price Trend ($/kWh) |
$95 |
$82 |
$75 |
$70 |
Warning: Even after accounting for typical capacity utilization rates (40-50%), the effective oversupply ratio of 1.2-1.5x means prices will continue to face downward pressure through 2027. Marginal manufacturers without cost advantages or technology differentiation will face existential pressure.
1.4 Price War Impact on Industry Health
| Impact Area |
Pre-Price War (2022) |
Current (2026) |
Risk Level |
Long-Term Consequence |
| LFP cell price ($/kWh) |
$150 |
$75 |
⚠️ High |
50% margin compression |
| System price ($/kWh) |
$350 |
$200 |
⚠️ Medium |
Lower barriers to entry |
| Manufacturer gross margin |
25-30% |
8-15% |
🔴 Critical |
R&D underinvestment |
| Quality variance |
Low (Tier 1 dominant) |
High (Tier 3 entering) |
🔴 Critical |
Safety incident risk |
| Bankability requirements |
Basic IEC certs |
Full Tier 1 + warranty fund |
⚠️ Medium |
Market consolidation |
| Warranty claim rate |
<0.5% |
1.2% (est.) |
⚠️ High |
Long-term liability |
2. Technology Monoculture: The 95% Lithium Problem
Lithium-ion batteries currently dominate the energy storage market, accounting for over 95% of installations. While mature and cost-effective, this overreliance creates systemic risks that the industry must address.
2.1 Technology Distribution and Risk Assessment
| Technology |
2024 Share |
2026 Share (Proj.) |
2030 Share (Proj.) |
Key Risk |
Diversification Potential |
| LFP (Lithium Iron Phosphate) |
82% |
78% |
60% |
Resource concentration |
↘ Declining |
| NMC (Nickel Manganese Cobalt) |
14% |
12% |
8% |
Cobalt dependency |
↘ Declining |
| Sodium-ion |
0.5% |
3% |
10% |
Lower energy density |
↗ Growing fast |
| Flow batteries (Vanadium) |
1.5% |
3% |
8% |
High upfront cost |
↗ Long-duration niche |
| Solid-state |
<0.1% |
1% |
5% |
Commercialization risk |
↗ Emerging |
| Compressed Air (CAES) |
1.5% |
2% |
4% |
Geography-limited |
→ Stable |
| Lead-acid (legacy) |
0.5% |
0.3% |
0.1% |
Phase-out |
↘ Eliminated |
| Others (gravity, thermal) |
0.5% |
0.7% |
2% |
Niche applications |
→ Stable |
2.2 Why Diversification Matters: Risk Matrix
| Risk Factor |
LFP |
NMC |
Sodium-Ion |
Flow Battery |
Solid-State |
| Thermal runaway risk |
Low |
Medium |
Very Low |
None |
None |
| Raw material supply risk |
Medium (Li) |
High (Co, Ni) |
Very Low (Na) |
Medium (V) |
Medium (Li) |
| Energy density (Wh/kg) |
160-180 |
200-260 |
140-160 |
30-50 |
400-500 |
| Cycle life |
6,000-8,000 |
3,000-5,000 |
5,000-8,000 |
10,000-15,000 |
8,000-10,000 |
| Cost ($/kWh cell) |
$75 |
$95 |
$50 |
$200 |
$300+ |
| Commercial maturity |
Mass production |
Mass production |
Early production |
Limited production |
Pilot production |
| Best application |
All-round |
EVs, portable |
Stationary storage |
Long-duration (4h+) |
EVs, premium storage |
2.3 Emerging Technology Roadmap
| Technology |
Current Status (2026) |
Commercial Timeline |
Cost Target 2030 |
Key Players |
| Sodium-ion |
Early mass production (7 GWh) |
2026-2028 |
$40/kWh |
CATL, HiNa, Natron |
| Solid-state (oxide) |
Pilot lines (0.5 GWh) |
2027-2030 |
$120/kWh |
Toyota, QuantumScape, Qingtao |
| Solid-state (sulfide) |
Lab to pilot (0.1 GWh) |
2028-2032 |
$100/kWh |
Samsung SDI, Solid Power |
| Vanadium flow |
Commercial (2 GWh) |
Already commercial |
$150/kWh |
Sumitomo, Rongke, VRB |
| Iron-air |
Pilot (0.05 GWh) |
2028-2030 |
$25/kWh |
Form Energy, MIT spinoff |
| CAES (advanced) |
Commercial (100 MW+) |
Already commercial |
$100/kWh |
Hydrostor, China Salt Cavern |
| Gravity storage |
Demonstration (5 MW) |
2029-2032 |
$80/kWh |
Energy Vault, Gravitricity |
Strategic Insight: By 2030, non-lithium technologies are expected to capture 15-20% of the market. Investors should track sodium-ion (fastest commercialization), solid-state (highest performance ceiling), and flow batteries (best long-duration economics) as diversification plays.
3. Policy Support: A Double-Edged Sword
3.1 Global Policy Landscape
Government policies have been instrumental in driving the sector’s growth—but they also create dependency risks. Understanding the global policy landscape is essential for long-term strategic planning.
| Region |
Key Policy |
Benefit Level |
Phase-Out Risk |
2026 Status |
| China |
Mandatory storage for renewable projects |
High (mandate-driven) |
Low (structural) |
Expanding to provincial level |
| USA |
IRA 30% ITC + 45X manufacturing credit |
Very High (tax credits) |
Medium (political) |
Active through 2032 |
| EU |
REPowerEU + Net-Zero Industry Act |
Medium (grants + targets) |
Low (structural) |
Accelerating deployment |
| UK |
Capacity Market + Contracts for Difference |
Medium (market-based) |
Low |
Stable |
| Australia |
State-level VPP programs + SRES |
Medium (rebates) |
Medium |
Transitioning to market |
| Japan |
Green Innovation Fund + subsidy |
Medium (R&D focus) |
Low |
Expanding |
| India |
PLI Scheme ($3.2B) + import duties |
High (manufacturing) |
Low |
Phase 2 launching |
| South Korea |
ESS subsidy + fire safety regs |
Medium |
Medium |
Recovering from safety issues |
3.2 Policy Risk Scenarios
| Risk Scenario |
Probability |
Impact |
Affected Markets |
Mitigation Strategy |
| US IRA rollback/modification |
30% |
🔴 Severe |
US (40% of growth) |
Diversify to EU/AU markets |
| China subsidy acceleration cut |
15% |
⚠️ Moderate |
China (28% of global) |
Focus on mandate-driven demand |
| EU trade barriers on Chinese batteries |
45% |
⚠️ Moderate |
EU supply chain |
Localize manufacturing in EU |
| US tariffs on Chinese storage |
60% |
🔴 Severe |
US-China trade |
SE Asia manufacturing base |
| Global safety regulations tightening |
80% |
⚠️ Moderate |
All markets |
Exceed UL 9540A standards |
| Lithium resource nationalism |
35% |
⚠️ Moderate |
Supply chain |
Secure long-term contracts |
3.3 The Subsidy Dependency Trap
| Market Segment |
Subsidy Dependency |
Profitable Without Subsidy? |
Timeline to Independence |
Critical Milestone |
| Utility-scale BESS (China) |
40% |
Partially (grid services) |
2027 |
Capacity payment reforms |
| Utility-scale BESS (US) |
60% |
No (needs ITC) |
2032 |
IRA expiration |
| Residential storage (AU) |
30% |
Almost (high electricity) |
2026 |
Grid parity reached |
| Residential storage (EU) |
35% |
Partially (varies by country) |
2028 |
Net metering reforms |
| Commercial/industrial |
15% |
Yes (demand charge savings) |
2026 |
Already profitable |
| Microgrid/off-grid |
10% |
Yes (diesel replacement) |
2025 |
Already profitable |
For projects requiring reliable energy storage solutions independent of subsidies, commercial and industrial applications already offer compelling economics without government incentives.
4. Supply Chain Vulnerabilities
4.1 Critical Material Dependency
| Material |
2026 Demand |
Supply Concentration |
Price Volatility |
Substitute Available? |
Risk Level |
| Lithium carbonate |
1.2M tons |
Australia 55%, Chile 25%, China 15% |
High (±40% YoY) |
Sodium (partial) |
⚠️ Medium |
| Cobalt |
180K tons |
DRC 70%, China 15% |
Very High (±60% YoY) |
NMC→LFP shift |
↘ Declining |
| Nickel (Class 1) |
350K tons |
Indonesia 50%, Philippines 15% |
High (±35% YoY) |
LFP (no Ni) |
⚠️ Medium |
| Graphite |
900K tons |
China 65%, Mozambique 15% |
Medium (±25% YoY) |
Hard carbon (Na-ion) |
⚠️ Medium |
| Electrolyte (LiPF6) |
200K tons |
China 75%, Japan 15% |
Medium (±20% YoY) |
Solid electrolyte |
⚠️ Medium |
| Copper foil |
400K tons |
China 50%, Korea 20% |
Low (±15% YoY) |
Aluminum (partial) |
Low |
| Vanadium |
15K tons (flow) |
China 60%, Russia 20% |
Very High (±50% YoY) |
Iron-based electrolyte |
🔴 High |
4.2 Geographic Concentration Risk
| Supply Chain Stage |
Top 3 Countries |
Combined Share |
Diversification Effort |
2026 Bottleneck Risk |
| Raw material mining |
Australia, Chile, Indonesia |
70% |
↗ Improving (Africa, Canada) |
Low |
| Refining/processing |
China, Korea, Japan |
85% |
↘ Slow (EU/US building) |
⚠️ Medium |
| Cell manufacturing |
China, Korea, US |
80% |
↗ Improving (EU, India) |
Low |
| Pack/system assembly |
China, US, EU |
75% |
↗ Improving (localized) |
Low |
| Recycling |
China, EU, Korea |
70% |
↗ Growing (regulatory push) |
Low (emerging) |
5. Investment Landscape & Capital Flows
5.1 Where Is the Money Going?
| Investment Category |
2024 ($B) |
2026 Proj. ($B) |
Growth |
Key Trend |
| Manufacturing capacity |
42.0 |
58.0 |
38% |
↘ Slowing (oversupply) |
| Project deployment |
28.0 |
45.0 |
61% |
↗ Accelerating |
| R&D / technology |
8.5 |
14.0 |
65% |
↗ Solid-state + Na-ion |
| Recycling infrastructure |
2.0 |
5.5 |
175% |
↗ Regulatory-driven |
| Grid integration software |
3.5 |
7.0 |
100% |
↗ AI/ML optimization |
| VPP / aggregation platforms |
1.5 |
4.0 |
167% |
↗ Emerging business model |
| Total |
85.5 |
133.5 |
56% |
↗ Shifting to deployment |
5.2 Investor Risk-Return Profile by Segment
| Segment |
Investment Horizon |
Expected IRR |
Risk Level |
Capital Intensity |
Best For |
| Cell manufacturing |
5-7 years |
12-18% |
⚠️ Medium-High |
🔴 Very High ($1B+) |
Strategic investors |
| System integration |
3-5 years |
18-25% |
⚠️ Medium |
⚠️ High ($50-200M) |
PE/VC |
| Project development |
2-4 years |
15-22% |
⚠️ Medium |
⚠️ Medium ($10-100M) |
Infrastructure funds |
| VPP software |
3-5 years |
30-50% |
⚠️ Medium |
Low ($5-20M) |
VC / growth equity |
| Recycling |
5-8 years |
20-30% |
⚠️ Medium |
⚠️ High ($50-200M) |
PE / strategic |
| Next-gen tech (SSB/Na-ion) |
7-10 years |
40-100%+ |
🔴 High |
Medium ($20-100M) |
Deep-tech VC |
| Distributed storage (C&I) |
3-5 years |
20-30% |
Low |
Low ($1-10M per project) |
PE / family offices |
6. Application Opportunities: Where Growth Is Real
6.1 High-Growth Application Segments
| Application |
2024 Market (GWh) |
2026 Proj. (GWh) |
CAGR |
Profitability |
Entry Barrier |
| Grid-scale BESS |
95 |
170 |
34% |
⚠️ Moderate (price pressure) |
High |
| Solar+storage integration |
35 |
72 |
43% |
✅ Good |
Medium |
| Commercial/industrial |
22 |
48 |
48% |
✅ Very Good |
Low-Medium |
| Residential |
18 |
32 |
33% |
✅ Good (varies by market) |
Low |
| Microgrid/off-grid |
8 |
16 |
41% |
✅ Very Good |
Medium |
| EV charging + storage |
3 |
12 |
100% |
✅ Emerging |
Medium |
| V2G (vehicle-to-grid) |
0.5 |
3 |
145% |
⚠️ Early stage |
Low (regulatory) |
| Telecom backup |
6 |
8 |
16% |
✅ Stable |
Low |
6.2 The Solar+Storage Sweet Spot
| System Type |
Solar Size |
Storage Size |
Storage Tech |
ROI (Years) |
Best Markets |
| Residential retrofit |
5-10 kW |
10-15 kWh |
LFP |
6-9 |
AU, DE, IT, US |
| Commercial flat roof |
50-200 kW |
50-200 kWh |
LFP |
5-7 |
US, EU, Southeast Asia |
| Industrial ground-mount |
500 kW-2 MW |
200-500 kWh |
LFP / Na-ion |
4-6 |
Global (high electricity) |
| Utility solar+storage |
5-50 MW |
0.5-2 MWh |
LFP |
5-8 |
US, China, Australia |
| Off-grid microgrid |
10-100 kW |
20-100 kWh |
LFP / Flow |
3-6 (vs diesel) |
Africa, islands, remote |
| EV charging hub |
50-200 kW |
100-500 kWh |
LFP |
4-7 |
EU, US, China |
7. Competitive Landscape: Winners and Losers
7.1 Market Position Assessment
| Company Type |
Examples |
Market Position |
2026 Outlook |
Key Strength |
Key Risk |
| Tier 1 integrated |
CATL, BYD, LG, Samsung |
Dominant (60% share) |
↗ Stable growth |
Scale + cost |
Margin pressure |
| Tier 1 specialized |
Fluence, Tesla, Winaico |
Niche leaders |
↗ Premium growth |
Brand + integration |
Scaling costs |
| Tier 2 Chinese |
Huijue, Pylontech, Dyness |
Growing (C&I + residential) |
↗ Fast growth |
Flexibility + value |
Brand recognition |
| Tier 3 new entrants |
Various startups |
Marginal |
↘ At risk |
Low price |
Quality + survival |
| Next-gen tech |
QuantumScape, Form Energy |
Pre-commercial |
→ R&D phase |
Technology IP |
Commercialization |
| Software/platform |
Stem, AutoGrid, Olivine |
Emerging |
↗ High growth |
Software moat |
Customer acquisition |
7.2 Survival Criteria: What It Takes to Win
| Criterion |
Minimum Standard 2024 |
Minimum Standard 2026 |
Minimum Standard 2030 |
Weight |
| Manufacturing scale |
1 GWh |
5 GWh |
20 GWh |
15% |
| Cell cost ($/kWh) |
$100 |
$75 |
$55 |
20% |
| Technology differentiation |
Standard LFP |
Proprietary cell design |
Next-gen (SSB/Na-ion) |
20% |
| Bankability |
Bloomberg Tier 1 |
Tier 1 + warranty fund |
Tier 1 + insurance |
15% |
| Software/EMS capability |
Basic monitoring |
AI optimization |
Autonomous trading |
15% |
| Vertical integration |
Cell + pack |
Cell→system→project |
Material→recycling |
15% |
8. The “Deep-Water Zone”: Quality over Quantity
The industry is shifting from a “gold rush” to a “deep-water zone.” The core challenge is no longer rapid growth but achieving high-quality, sustainable development.
8.1 Quality Indicators: Boom vs. Maturity
| Indicator |
Boom Phase (2022-2024) |
Transition (2025-2026) |
Mature Phase (2028+) |
| Growth driver |
Policy + hype |
Cost competitiveness |
Market economics |
| Winner profile |
Fastest mover |
Lowest cost |
Best technology + service |
| Profit margin |
25-30% |
10-15% |
15-20% (consolidated) |
| Market consolidation |
Fragmented (200+ players) |
Consolidating (50-100) |
Oligopoly (20-30) |
| Technology focus |
Capacity expansion |
Cost reduction |
Performance + safety |
| Customer focus |
Any project |
Bankable projects |
Long-term partnerships |
| Regulatory focus |
Subsidy capture |
Compliance |
Standards leadership |
| Geographic focus |
Home market |
Regional expansion |
Global (localized) |
8.2 Risk Factors for the Deep-Water Zone
| Risk |
Probability |
Impact |
Timeline |
Mitigation |
| Major safety incident (large-scale fire) |
60% within 2 years |
🔴 Industry-wide setback |
2026-2027 |
UL 9540A + NFPA 855 compliance |
| Mass bankruptcies of Tier 3 players |
85% |
⚠️ Market disruption |
2026-2028 |
Avoid Tier 3 suppliers |
| Trade war escalation (US-China) |
50% |
⚠️ Supply chain disruption |
Ongoing |
Dual manufacturing bases |
| Lithium price spike |
30% |
⚠️ Cost reversal |
2027-2028 |
Sodium-ion alternatives |
| Grid integration failures |
40% |
⚠️ Regulatory tightening |
2026-2027 |
Advanced EMS + grid services |
| Insurance crisis (warranty claims) |
35% |
⚠️ Cost increase |
2027-2029 |
Quality + testing investment |
9. Strategic Recommendations: Choose Your Battles Wisely
9.1 For Investors
| Strategy |
Target Segment |
Investment Size |
Expected Return |
Time Horizon |
Key Risk |
| Core: System integrators |
Tier 1-2 integrators |
$50-200M |
15-25% IRR |
5-7 years |
Margin pressure |
| Growth: Solar+storage developers |
Project pipeline |
$20-100M |
18-30% IRR |
3-5 years |
Policy change |
| Opportunistic: VPP platforms |
Software companies |
$5-30M |
30-50% IRR |
3-5 years |
Scaling risk |
| Long-term: Next-gen tech |
SSB/Na-ion/Flow |
$10-50M |
40-100%+ IRR |
7-10 years |
Commercialization |
| Defensive: Recycling |
Material recovery |
$30-150M |
20-30% IRR |
5-8 years |
Feedstock supply |
9.2 For Manufacturers
| Priority |
Action |
Timeline |
Investment |
Expected Outcome |
| 1. Cost leadership |
Vertical integration + automation |
2026-2027 |
$50-100M |
Cell cost < $65/kWh |
| 2. Technology moat |
Develop SSB or Na-ion pilot line |
2026-2029 |
$20-80M |
Proprietary IP portfolio |
| 3. Software differentiation |
AI-driven EMS + predictive analytics |
2026 |
$5-15M |
20%+ margin premium |
| 4. Geographic diversification |
SE Asia or EU assembly plant |
2026-2028 |
$30-80M |
Tariff avoidance |
| 5. Quality + safety |
UL 9540A + IEC 62619 + warranty fund |
2026 |
$2-5M |
Bankability + trust |
| 6. Circular economy |
Recycling partnership/program |
2027-2028 |
$10-30M |
Material security + ESG |
9.3 For Project Developers
| Segment |
Best Markets 2026 |
Target IRR |
Key Success Factor |
Avoid |
| Utility-scale BESS |
US (ERCOT/CAISO), China, UK |
15-20% |
Long-term capacity contracts |
Merchant-only exposure |
| C&I storage |
US, Germany, Italy, Australia |
20-30% |
Demand charge optimization |
Low electricity price markets |
| Solar+storage |
US, Australia, Southeast Asia |
18-25% |
Self-consumption ratio > 60% |
Low irradiance regions |
| Microgrid |
Africa, islands, remote mining |
25-35% |
Diesel replacement economics |
Grid-connected sites |
| EV charging + storage |
EU, US, China |
15-25% |
Site selection + demand |
Low EV adoption areas |
10. Huijue Group: Navigating the Transformation
In this rapidly evolving landscape, choosing the right energy storage partner is more critical than ever. Huijue Group has positioned itself in the commercial and industrial storage segment—exactly where market economics are strongest and subsidy dependency is lowest.
10.1 Huijue Product Portfolio: Aligned with Growth Segments
| Model |
Capacity |
Power |
Target Application |
Market Segment |
Growth Outlook |
| HJ-G0025-0050F |
25-50 kWh |
25-50 kW |
Small C&I / retail |
Commercial |
↗ 48% CAGR |
| HJ-G0050-0157L |
157 kWh |
50 kW |
Office buildings |
Commercial |
↗ 48% CAGR |
| HJ-G0050-0209L |
209 kWh |
50-60 kW |
Small industrial |
C&I |
↗ 48% CAGR |
| HJ-G0050-0225F |
225 kWh |
50-100 kW |
Industrial facilities |
Industrial |
↗ 48% CAGR |
| HJ-G0110-0241 |
241 kWh |
110 kW |
Manufacturing |
Industrial |
↗ 48% CAGR |
| HJ-G0125-0261 |
261 kWh |
125 kW |
Industrial / utility |
Industrial/Utility |
↗ 43% CAGR |
| HJ-G0215-0418 |
418 kWh |
215 kW |
Utility-scale |
Utility |
↗ 34% CAGR |
10.2 Strategic Alignment with Market Trends
| Market Trend |
Huijue Response |
Competitive Advantage |
| Oversupply → quality differentiation |
LFP cells with 8,000+ cycle life |
20% longer lifespan than Tier 3 |
| Technology diversification |
Sodium-ion compatible cabinet design |
Future-proof architecture |
| C&I growth (48% CAGR) |
25-418 kWh modular range |
Covers full C&I spectrum |
| Solar+storage integration |
AC/DC coupled compatibility |
Retrofit-ready design |
| Software differentiation |
Cloud-based EMS + remote monitoring |
AI optimization built-in |
| Safety regulations tightening |
UL 9540A + IEC 62619 certified |
Exceeds 2026 standards |
| Subsidy independence |
C&I demand-charge savings model |
Profitable without subsidies |
Ready to Navigate the Energy Storage Transformation?
Whether you’re evaluating investment opportunities, planning a solar+storage project, or seeking a reliable storage partner, Huijue Group’s engineering team can help you design the optimal solution for your specific needs.
📧 Contact Huijue Group for a free consultation and market-specific ROI analysis.
Frequently Asked Questions
Q1: Is the energy storage market still growing in 2026?
Yes, but growth is decelerating. Global new energy storage installations reached 187 GWh in 2024 (92% YoY growth) and are projected to hit 250 GWh in 2025 (33% growth) and 340 GWh by 2026 (36% growth). The industry is transitioning from a “boom phase” to a “stable growth phase,” with annual growth rates cooling from 90%+ to 30-40%. While still expanding rapidly, the slowdown signals maturation and increased competition.
Q2: What are the biggest risks in the energy storage industry?
The three biggest risks are: (1) Oversupply—announced capacity expansion plans exceed 900 GWh vs. projected 2026 demand of 340 GWh, triggering price wars; (2) Technology monoculture—lithium-ion batteries account for 95%+ of installations, creating vulnerability to resource constraints and safety incidents; (3) Policy dependency—government subsidies drive growth but create uncertainty when phased out. Companies must diversify technology pathways and build sustainable competitive advantages beyond subsidies.
Q3: Which energy storage technologies will replace lithium-ion batteries?
No single technology will fully replace lithium-ion, but several are gaining traction: solid-state batteries (500+ Wh/kg, 8,000+ cycles, commercial pilot stage), sodium-ion batteries (30-35% cheaper than LFP, ideal for stationary storage), vanadium flow batteries (10,000+ cycles, 25-year lifespan for long-duration storage), and compressed air energy storage (100+ MW scale, 40-60% round-trip efficiency). By 2030, non-lithium technologies are expected to capture 15-20% of the market.
Q4: How much does energy storage cost per kWh in 2026?
In 2026, LFP battery cell costs range from $70-90/kWh, NMC cells from $85-110/kWh, and system-level costs from $180-280/kWh depending on scale and application. Residential storage systems cost $400-600/kWh installed, while utility-scale BESS costs $180-250/kWh. Sodium-ion systems are entering the market at $150-200/kWh system cost. Prices have fallen 60% since 2022 but are approaching a floor due to raw material costs.
Q5: What is the best energy storage investment strategy for 2026?
The best strategy focuses on three areas: (1) Technology differentiation—invest in solid-state, sodium-ion, or flow battery companies with proven pilot production; (2) Application-specific solutions—target high-growth niches like offshore wind storage, solar-plus-storage integration, and V2G systems; (3) Vertical integration—companies controlling raw materials through end-user applications have the strongest competitive moats. Avoid pure-play manufacturers without proprietary technology, as price competition will eliminate marginal players.
Q6: Can energy storage systems integrate with existing solar installations?
Yes. Retrofitting energy storage to existing solar installations is a major growth segment. For residential systems, adding a 10-15 kWh LFP battery to a 5-10 kW solar array increases self-consumption from 30% to 70%+ and provides backup power. For commercial systems, Huijue Group offers cabinet energy storage systems (25-418 kWh) that integrate with existing solar via AC-coupled or DC-coupled configurations. ROI for solar-plus-storage retrofits typically ranges from 5-8 years depending on local electricity rates and incentive programs.
Conclusion
The energy storage industry in 2026 is at an inflection point. The explosive growth of 2022-2024 has given way to a more mature, competitive landscape where success demands more than simply riding the wave. Oversupply, technology monoculture, policy dependency, and margin pressure are reshaping the competitive dynamics—rewarding companies with genuine technological advantages, vertical integration, and application-specific expertise.
For those who identify strategic niches and seize emerging opportunities—particularly in solar+storage integration, C&I applications, and next-generation technologies—the rewards could be substantial. But only with patience, precision, and a clear-eyed view of the risks.
The era of “get-rich-quick” energy storage is over. The era of “get-rich-smart” has begun.
Planning your energy storage strategy? Contact Huijue Group for expert consultation, customized system design, and market-specific ROI analysis.
Important Disclaimer
All data regarding cost savings, returns, payback periods, investment costs, etc., mentioned in this article/video are theoretical deductions based on specific assumptions (e.g., annual power consumption of 1 million kWh, electricity tariff of ¥0.8/kWh, photovoltaic utilization hours) – they do not represent actual return commitments nor constitute purchase or investment advice; actual returns may vary significantly due to factors such as sunlight conditions, electricity price fluctuations, equipment and installation costs, and subsidy policies, so please verify the latest market prices independently and consult professionals before making any investment decisions.

 chinahuijue@gmail.com
 +1 (702) 204-9855