
 chinahuijue@gmail.com
 +1 (702) 204-9855
Energy Storage Industry Outlook 2025–2030: Growth, Trends & Investment Map
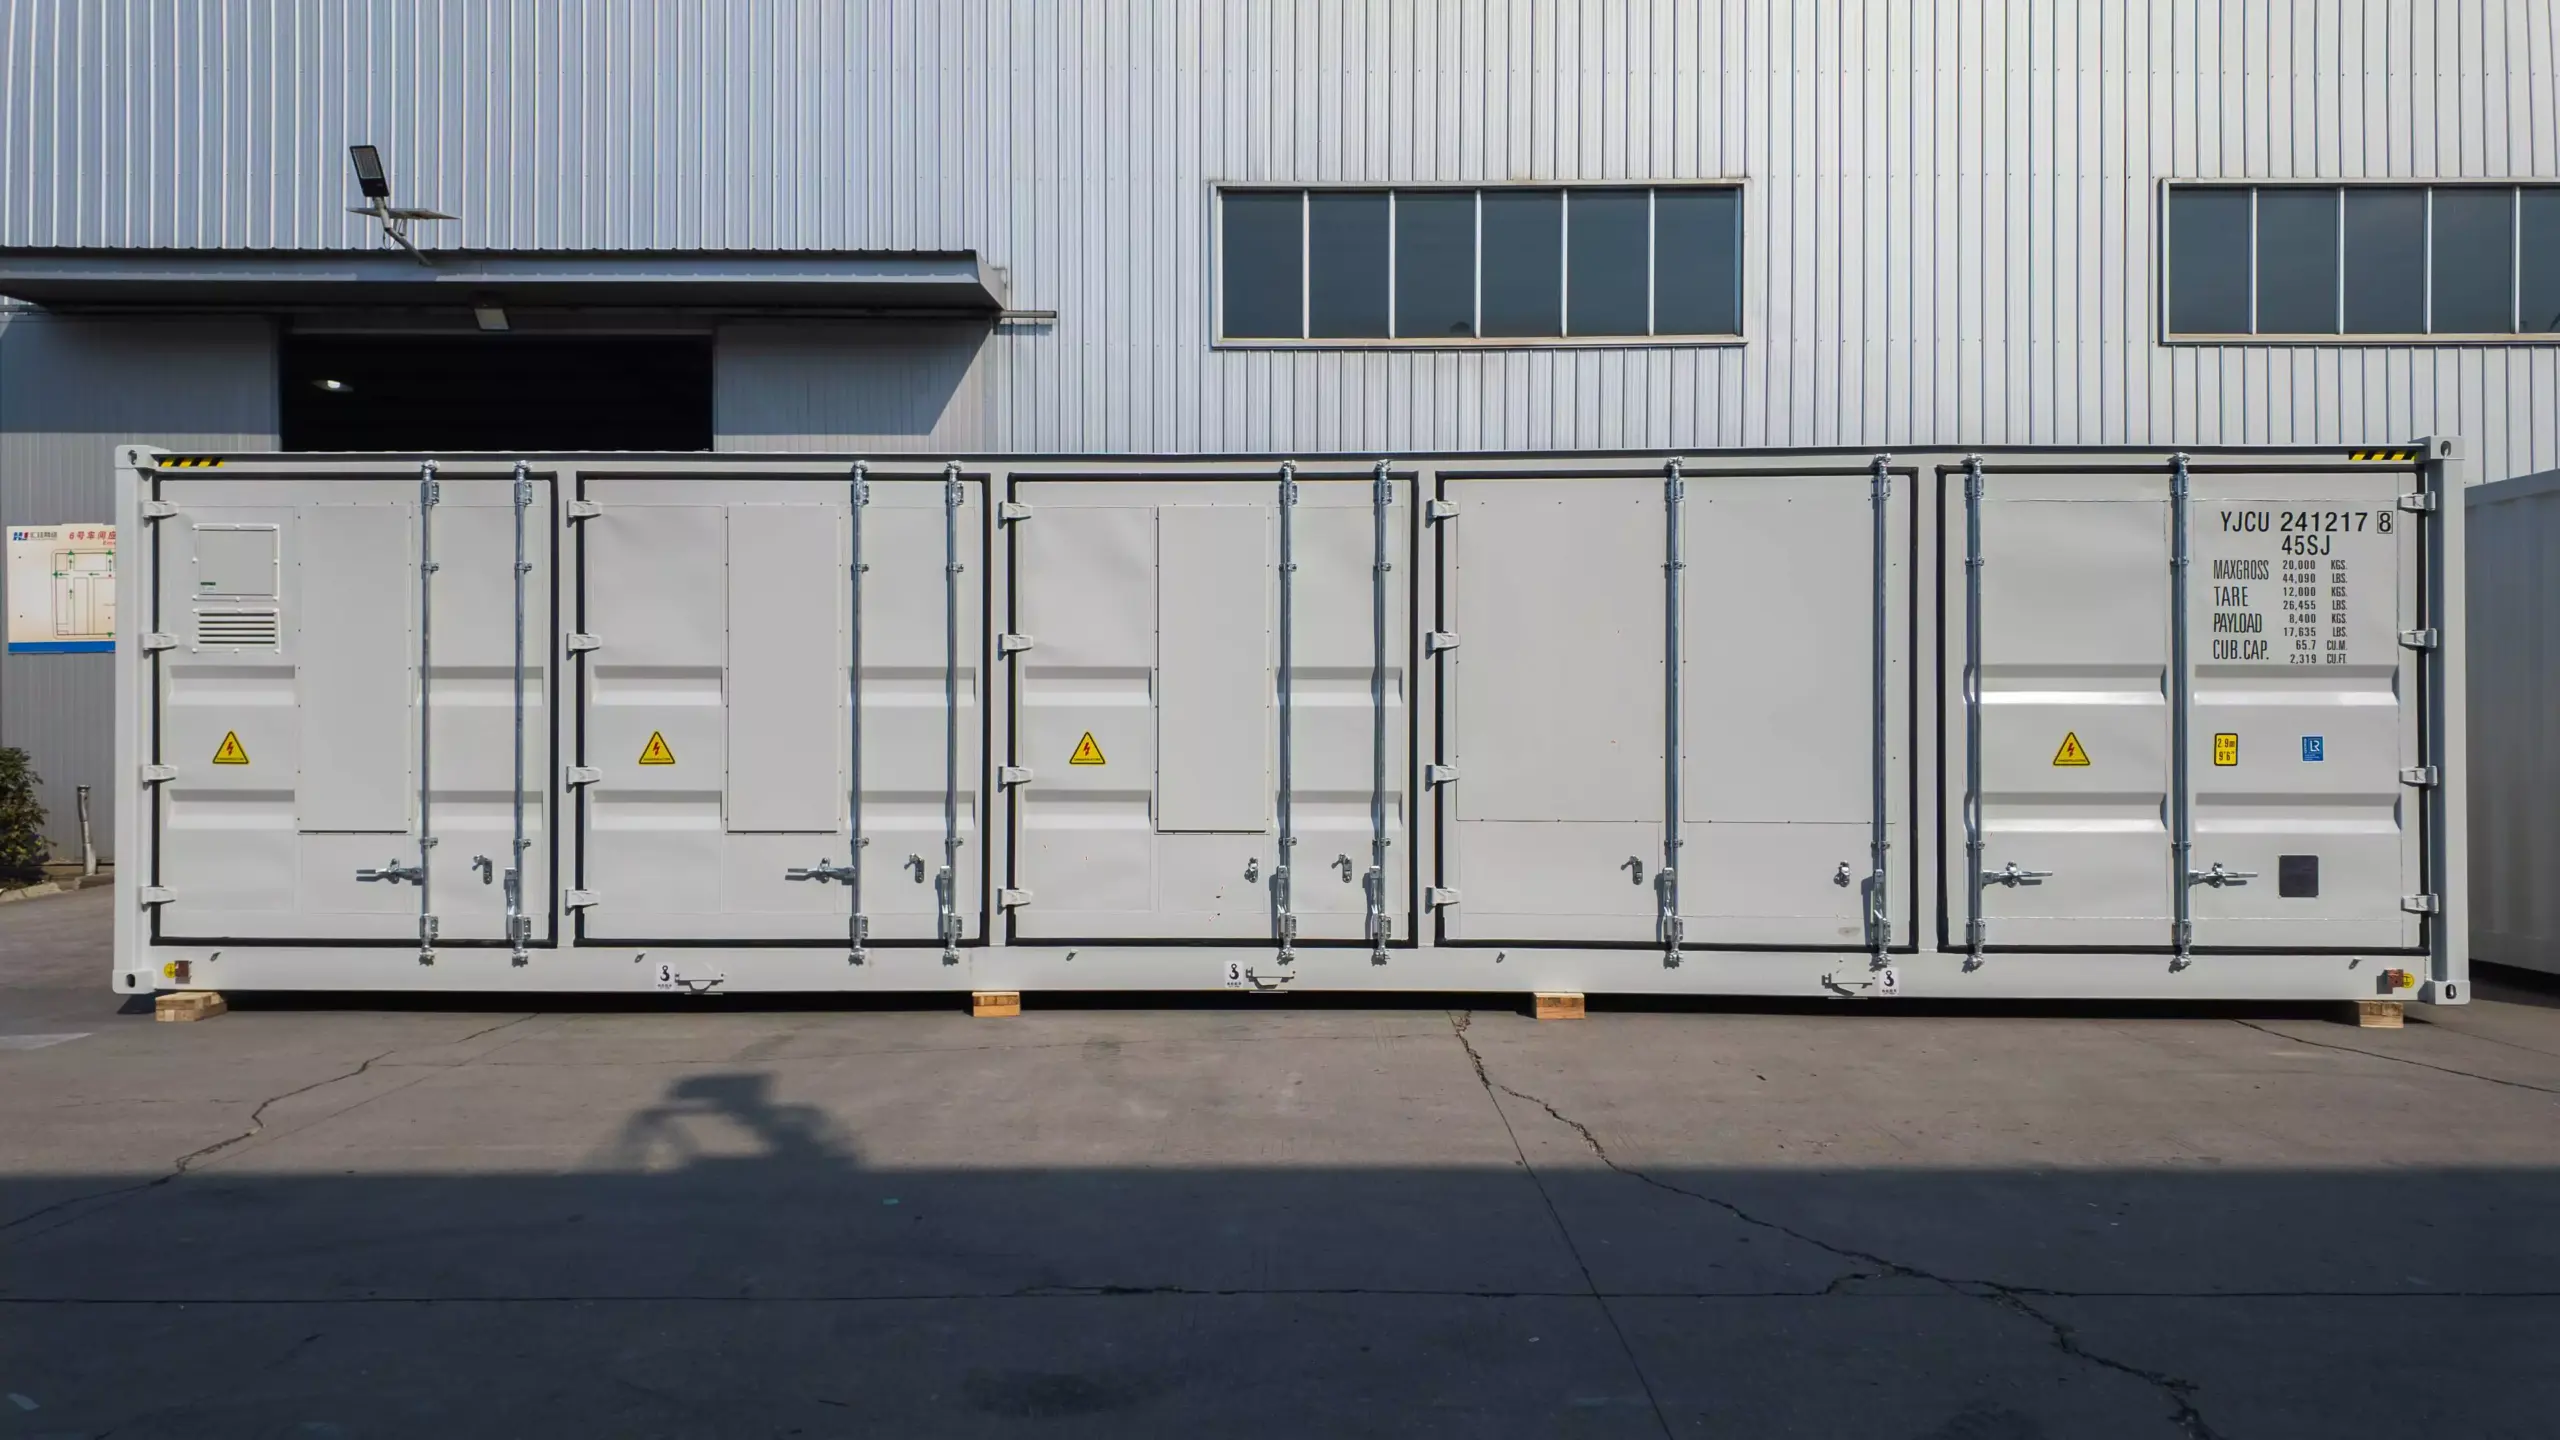
Focus Keyword: energy storage industry outlook
SEO Title: Energy Storage Industry Outlook 2025-2030: Growth & Trends
Meta Description: Comprehensive energy storage industry outlook 2025-2030: market size, regional growth, sodium-ion & solid-state breakthroughs, investment opportunities, and risks.
Tags: Energy Storage Industry, BESS Market 2030, Sodium-Ion Battery, Solid-State Battery, Energy Storage Investment, Grid-Forming Storage, Huijue Group, Renewable Energy Storage
Quick Answer
| Metric | 2025 Value | 2030 Projection | Key Driver |
|---|---|---|---|
| Global market size | USD 295 billion | USD 465 billion | Renewable penetration + policy support |
| Annual deployments | 92–112 GW / 247–290 GWh | 220+ GW (China alone) | BNEF, IEA forecasts |
| System cost decline | 15–20% vs 2024 | 30–40% total reduction | Scale manufacturing + tech iteration |
| Top 10 market share | ~80% | 85%+ | Industry consolidation |
| Sodium-ion cost | ~$59/kWh | <$45/kWh | Mass production scale-up |
| Grid-forming storage | 7 GW penetration | 50+ GW | Grid stability requirements |
The energy storage industry outlook for 2025–2030 points to sustained explosive growth, with the sector transitioning from scale expansion to technology-driven, high-quality development. According to BloombergNEF, global energy storage deployments (excluding pumped hydro) reached 92–112 GW in 2025, crossing the 100 GW threshold for the first time. The market is valued at approximately USD 295 billion in 2025 and is projected to reach USD 465 billion by 2030 at a CAGR of 9.53%. For businesses exploring containerized energy storage solutions, understanding these trends is critical for strategic planning and investment decisions.
Table of Contents
- 1. Core Driving Forces: Policy, Demand & Technology
- 2. Global Market Growth: Regional Breakdown
- 3. Segmented Track Opportunities
- 4. Technology Iteration: From “Bigger” to “Smarter”
- 5. Sodium-Ion & Solid-State: The Next Frontier
- 6. Grid-Forming Storage & Intelligent Upgrade
- 7. Potential Risks & Challenges
- 8. Investment Directions & High-Barrier Segments
- 9. Huijue’s Position in the Energy Storage Value Chain
- 10. Future Outlook: 2030 and Beyond
- FAQ
1. Core Driving Forces: Policy, Demand & Technology
The energy storage industry is propelled by a “troika” of policy support, renewable energy demand, and technological progress. Each driver reinforces the others, creating a compounding growth effect that shows no signs of slowing before 2030.
1.1 Policy Support: From Subsidies to Market Mechanisms
Under China’s “dual carbon” goals, new energy storage is designated as a key pillar of the new power system. In 2025, policy focus shifted from direct subsidies to market-oriented mechanisms—including electricity price compensation, spot trading, and shared energy storage models—accelerating the transition from “policy-driven” to “market-driven” development.
| Policy Category | 2025 Focus | Impact on Energy Storage | Key Regions |
|---|---|---|---|
| Electricity price compensation | Peak-valley spread widening | Improves user-side ROI by 20–30% | China (Jiangsu, Zhejiang, Guangdong) |
| Spot market trading | Energy storage participation rules | Enables arbitrage revenue streams | China, UK, Australia |
| Shared energy storage | Capacity leasing models | Reduces capex barrier for renewables | Inner Mongolia, Xinjiang, Shandong |
| US ITC tax credit | 30% investment tax credit | Drives pre-tariff rush installations | United States (Texas, California) |
| EU Green Deal | Capacity market mechanisms | 60%+ growth in Germany & Spain | Germany, Spain, Italy |
| Middle East Vision 2030 | Local content requirements | GWh-scale tender projects | Saudi Arabia, UAE |
1.2 Rigid Demand: Renewable Penetration Surge
As renewable energy penetration exceeds 20% in China (2025 estimate) and continues climbing globally, the volatility of solar and wind generation creates an unavoidable need for energy storage to provide peak shaving and frequency regulation. The International Energy Agency projects global new photovoltaic installations of 490 GW in 2025, directly driving storage demand growth.
| Renewable Milestone | 2025 Status | 2030 Target | Storage Implication |
|---|---|---|---|
| China renewable share | >20% of generation | 40%+ | 110+ GWh source-grid storage needed |
| Global PV new installs | 490 GW | 700+ GW | 1:0.2 PV-to-storage ratio emerging |
| Global wind new installs | 120 GW | 200+ GW | Long-duration storage demand surge |
| Data center “PV+Storage” | Emerging | Standard requirement | Explosive demand in Middle East |
| EV charging + storage | Pilot phase | Mainstream | Virtual power plant integration |
1.3 Technology & Cost: The Relentless Decline
Battery cell technology advances and manufacturing scale efficiencies continue to drive down energy storage system costs. In 2025, system costs are projected to fall 15–20% compared to 2024, with further declines expected through 2030.
| Cost Component | 2024 Cost ($/kWh) | 2025 Cost ($/kWh) | Decline | 2030 Projection ($/kWh) |
|---|---|---|---|---|
| LFP battery cell | 65–70 | 52–58 | 15–20% | 35–40 |
| Sodium-ion cell | 70–75 | 55–62 | 15–20% | 40–45 |
| BESS system (integrated) | 180–220 | 150–180 | 15–18% | 100–120 |
| PCS (power conversion) | 25–35 | 20–28 | 15–20% | 12–18 |
| BMS + EMS | 15–20 | 12–16 | 20–25% | 8–10 |
| Total system cost | 220–270 | 180–220 | 15–20% | 120–150 |
2. Global Market Growth: Regional Breakdown
The energy storage market is experiencing a multi-regional boom, with distinct dynamics shaping each geography. Understanding regional differences is essential for investors, developers, and equipment suppliers seeking to capitalize on structural opportunities.
2.1 Regional Market Comparison
| Region | 2025 New Installs | YoY Growth | Key Driver | 2030 Cumulative Target |
|---|---|---|---|---|
| China | 110+ GWh (source-grid) 50%+ (C&I user-side) |
35–40% | Dual carbon + shared storage | 220 GW cumulative |
| United States | 45+ GWh | 25–30% | ITC + pre-tariff rush | 120+ GW |
| Europe | 35+ GWh | 60%+ | Capacity markets + energy security | 80+ GW |
| Middle East | 15+ GWh | 200%+ | Vision 2030 + GWh tenders | 40+ GW |
| Australia | 8+ GWh | 40%+ | Grid stability + VPP | 20+ GW |
| Southeast Asia | 5+ GWh | 50%+ | Island grids + mini-grids | 15+ GW |
| Africa | 3+ GWh | 30%+ | Telecom + mini-grid | 10+ GW |
2.2 China: The Undisputed Leader
China remains the world’s largest energy storage market by a significant margin. In 2025, source-grid side installed capacity is expected to exceed 110 GWh, with Inner Mongolia, Xinjiang, and other renewable-rich provinces leading deployment. The user-side industrial and commercial (C&I) storage segment grows at over 50% annually, driven by peak-valley price arbitrage and centralized procurement by high-energy-consuming enterprises.
| China Segment | 2025 Installations | Growth Rate | Revenue Model | Leading Provinces |
|---|---|---|---|---|
| Source-grid storage | 110+ GWh | 35% | Capacity leasing + spot trading | Inner Mongolia, Xinjiang, Shandong |
| Industrial & commercial | 25+ GWh | 50%+ | Peak-valley arbitrage + demand charge | Jiangsu, Zhejiang, Guangdong |
| Shared storage stations | 40+ GWh | 45% | Multi-party revenue sharing | Shandong, Henan, Hunan |
| Residential storage | 5+ GWh | 30% | Self-consumption + backup | Zhejiang, Guangdong |
2.3 United States: Pre-Tariff Rush & Local Manufacturing
The US energy storage market is experiencing a surge in 2025 as developers rush to install before anticipated tariff increases to 25% in 2026. Pre-meter (front-of-meter) energy storage drives new installed capacity above 45 GWh. The high-gross-profit market attracts Chinese companies to establish local manufacturing capacity.
| US Market Segment | 2025 Capacity | Average Project Size | Key States | Revenue Stack |
|---|---|---|---|---|
| Utility-scale (front-of-meter) | 38+ GWh | 100–400 MWh | Texas, California, Arizona | Capacity + arbitrage + ancillary |
| Commercial & industrial | 5+ GWh | 0.5–5 MWh | California, New York | Demand charge + arbitrage |
| Residential | 3+ GWh | 10–20 kWh | California, Texas, Florida | Self-consumption + backup |
| Community storage | 2+ GWh | 2–10 MWh | Massachusetts, New York | Shared savings model |
2.4 Europe: Policy Maturity & Energy Security
Europe’s mature capacity market mechanisms and policy subsidies position it for growth exceeding 60% in 2025. Germany and Spain emerge as the primary incremental markets, driven by renewable integration needs and energy security imperatives following the reduction of Russian gas dependency.
| European Country | 2025 Growth | Primary Driver | Policy Mechanism | Storage Type Focus |
|---|---|---|---|---|
| Germany | 70%+ | Residential solar+storage | KfW subsidy + feed-in tariff reform | Residential (5–15 kWh) |
| Spain | 80%+ | Utility-scale solar pairing | Capacity auction + EU funds | Utility-scale (50–500 MWh) |
| Italy | 55%+ | Grid stability + islands | Capacity market + FER decree | Utility + island microgrids |
| UK | 45%+ | Frequency response | Capacity market + dynamic containment | Utility-scale (50–200 MWh) |
| Netherlands | 40%+ | Grid congestion relief | SDE++ + congestion management | C&I + utility |
2.5 Middle East: Emerging GWh Superpower
Saudi Arabia, the UAE, and other Gulf states are executing ambitious new energy replacement plans that spawn GWh-scale storage projects. The Middle East may become the world’s fourth-largest energy storage market in 2025, with photovoltaic-storage-powered data centers already proving economical.
| Middle East Project | Capacity | Technology | Timeline | Investment |
|---|---|---|---|---|
| Saudi NEOM storage | 4 GWh | LFP + flow battery hybrid | 2025–2027 | $2.5B+ |
| UAE Mohammed bin Zayed | 1.5 GWh | Lithium-ion | 2025–2026 | $1.2B |
| Saudi ACWA Power | 3 GWh | LFP container | 2025–2028 | $2B |
| UAE Masdar storage | 1 GWh | Solid-state pilot | 2026–2028 | $800M |
| Oman solar+storage | 0.8 GWh | LFP | 2025–2027 | $600M |
3. Segmented Track Opportunities
Within the broader energy storage market, several segmented tracks offer differentiated growth profiles and investment theses. Understanding these segments helps investors and developers identify where the most attractive risk-adjusted returns lie.
3.1 Large-Scale Storage: The Volume Driver
| Large Storage Segment | 2025 Global Share | Typical Project Size | Key Markets | 2025–2030 CAGR |
|---|---|---|---|---|
| Utility-scale solar+storage | 40% | 100–500 MWh | US, China, Middle East | 28% |
| Independent storage stations | 20% | 200–1000 MWh | China, US, Australia | 35% |
| Wind+storage hybrid | 10% | 50–300 MWh | US, UK, China | 30% |
| Shared storage (China) | 15% | 100–500 MWh | China | 40% |
| Grid stability projects | 5% | 20–100 MWh | UK, Australia, Germany | 25% |
3.2 Industrial & Commercial Storage: The Growth Star
The overseas C&I storage market growth rate exceeds 100% in 2025, with application scenarios diversifying rapidly. For organizations evaluating C&I cabinet energy storage solutions, the economics have become compelling across multiple use cases.
| C&I Application | Typical Size | ROI Period | Primary Revenue | Growth Rate |
|---|---|---|---|---|
| Manufacturing facility | 0.5–5 MWh | 3–5 years | Peak shaving + demand charge | 80%+ |
| Data center | 2–20 MWh | 4–6 years | UPS + arbitrage + green power | 120%+ |
| Commercial building | 0.1–1 MWh | 5–7 years | Peak shaving + self-consumption | 60%+ |
| EV charging station | 0.2–2 MWh | 3–5 years | Grid upgrade deferral + arbitrage | 150%+ |
| Industrial park | 5–50 MWh | 4–6 years | Multi-tenant shared savings | 90%+ |
| Island/remote microgrid | 1–10 MWh | 5–8 years | Diesel displacement | 70%+ |
3.3 Long-Duration Storage: The Emerging Frontier
| Long-Duration Technology | Duration | 2025 Cost ($/kWh) | 2030 Cost Target ($/kWh) | Commercial Maturity |
|---|---|---|---|---|
| 4-hour LFP | 4–6 hours | 180–220 | 100–120 | Commercial |
| 6–8 hour LFP | 6–8 hours | 220–280 | 130–160 | Early commercial |
| Vanadium flow battery | 4–10 hours | 350–500 | 180–250 | Demonstration → early commercial |
| Compressed air (CAES) | 8–24 hours | 200–300 | 120–180 | Demonstration |
| Gravity storage | 8–16 hours | 300–400 | 150–200 | Pilot |
| Thermal storage | 6–24 hours | 80–150 | 50–80 | Early commercial |
4. Technology Iteration: From “Bigger” to “Smarter”
The energy storage industry is undergoing a fundamental technology shift—from simply scaling up capacity to creating intelligent, adaptive systems. Three parallel technology tracks are reshaping the competitive landscape.
4.1 Large-Capacity Cells & System Integration
In 2025, mainstream battery cell capacity reaches 400Ah+, with leading manufacturers pushing toward 500Ah+ and even 600Ah+ cells. The capacity of 20-foot container energy storage systems exceeds 8 MWh, with CATL, Envision Energy, and other leaders driving the technology upgrade.
| Cell/Module Parameter | 2023 | 2024 | 2025 | 2027 Target | 2030 Target |
|---|---|---|---|---|---|
| Mainstream cell capacity | 280Ah | 314Ah | 400–587Ah | 600Ah+ | 800Ah+ |
| Cell energy density | 170 Wh/kg | 180 Wh/kg | 190–200 Wh/kg | 210 Wh/kg | 230+ Wh/kg |
| 20ft container capacity | 3.44 MWh | 5 MWh | 8–9 MWh | 12 MWh | 15+ MWh |
| System cycle life | 6,000 | 8,000 | 10,000–12,000 | 15,000 | 20,000+ |
| System round-trip efficiency | 85% | 87% | 88–90% | 91% | 93%+ |
4.2 Cell-to-System Integration Trends
| Integration Approach | Description | Advantage | Adoption Status (2025) | Leading Companies |
|---|---|---|---|---|
| CTP (Cell-to-Pack) | Cells directly integrated into pack | 15–20% volume reduction | Mainstream | CATL, BYD, EVE |
| CTS (Cell-to-System) | Cells directly into container system | 30%+ volume reduction | Early adoption | CATL, Envision |
| Liquid cooling standard | Liquid cooling replaces air cooling | 5°C temp uniformity, 20% longer life | 70%+ of new projects | Sungrow, CATL, Huijue |
| DC-side integration | Single PCS for multiple battery racks | Lower BOS cost, simpler control | Growing | Huawei, Sungrow |
| Modular architecture | Hot-swappable modules | Reduced downtime, easy expansion | Becoming standard | Huijue, Tesla, BYD |
5. Sodium-Ion & Solid-State: The Next Frontier
Two breakthrough battery technologies—sodium-ion and solid-state—are moving from laboratory to commercial deployment in 2025, promising to reshape the energy storage cost curve and safety profile.
5.1 Sodium-Ion Battery: Commercialization Accelerating
BYD, CATL, and other major manufacturers have launched dedicated sodium-ion energy storage products. The 2025 average cost is approximately $59/kWh for sodium-ion versus $52/kWh for LFP, but sodium-ion offers superior safety, wider operating temperature range (-40°C to 80°C), and better low-temperature performance.
| Parameter | LFP (2025) | Sodium-Ion (2025) | Sodium-Ion Advantage | 2027 Projection (Na-ion) |
|---|---|---|---|---|
| Cell cost ($/kWh) | 52 | 59 | Converging (raw material cheaper) | 40–45 |
| Energy density (Wh/kg) | 180–200 | 140–160 | Lower (acceptable for stationary) | 170–180 |
| Cycle life | 10,000+ | 6,000–8,000 | Improving rapidly | 10,000+ |
| Operating temp range | -20°C to 60°C | -40°C to 80°C | Superior cold weather | -40°C to 80°C |
| Safety (thermal runaway) | Good | Excellent | Higher decomposition temp | Excellent |
| Raw material cost | Lithium carbonate dependent | Sodium (abundant, cheap) | No supply chain risk | Further reduction |
| Fast charge capability | 1C typical | 2–3C | 3x faster charging | 3–5C |
| Company | Sodium-Ion Product | Capacity (2025) | Target Application | Timeline |
|---|---|---|---|---|
| CATL | Na-ion Gen 2 | 10 GWh production | Stationary storage + 2W EVs | Mass production 2025 |
| BYD | Na-ion blade | 5 GWh pilot | Grid + C&I storage | Scale-up 2025–2026 |
| Hina Battery | Na-ion cube | 1 GWh | Stationary + telecom | Commercial 2025 |
| HiNa Battery | Na-ion pack | 2 GWh | Low-speed EV + storage | Expanding 2025–2026 |
| Faradion (Reliance) | Na-ion stack | 1 GWh | India grid storage | Commercial 2025–2026 |
5.2 Solid-State Battery: Safety & Energy Density Leap
Qingtao Energy, Tailan New Energy, and other companies have begun production of solid-state battery projects. While mass production costs remain high, their safety advantages and energy density potential make them ideal for large-scale energy storage scenarios where safety is paramount.
| Solid-State Parameter | Current Status (2025) | 2027 Target | 2030 Target | Key Advantage for Storage |
|---|---|---|---|---|
| Energy density | 250–300 Wh/kg | 350–400 Wh/kg | 450+ Wh/kg | Smaller footprint |
| Cell cost ($/kWh) | 150–200 | 80–100 | 50–60 | Cost convergence with LFP |
| Cycle life | 5,000–8,000 | 10,000+ | 15,000+ | Longer system life |
| Thermal stability | >300°C | >350°C | >400°C | Eliminates thermal runaway |
| Production capacity | 5–10 GWh (pilot) | 50–100 GWh | 500+ GWh | Scale manufacturing |
| Commercial readiness | Demonstration phase | Early commercial | Mainstream adoption | Safety-critical applications |
6. Grid-Forming Storage & Intelligent Upgrade
Beyond battery chemistry, two technology trends—grid-forming inverters and AI-powered intelligent management—are transforming how energy storage systems interact with the grid and operate day-to-day.
6.1 Grid-Forming Energy Storage
Huawei, Sungrow, and other companies are deploying active grid support technology through grid-forming inverters. Grid-forming storage penetration may reach 7 GW in 2025, growing exponentially as grid stability requirements intensify with higher renewable penetration.
| Grid-Forming Feature | Traditional (Grid-Following) | Grid-Forming | Grid Stability Benefit | Deployment Status |
|---|---|---|---|---|
| Inertia response | None | Synthetic inertia | 50%+ improvement in frequency stability | Pilot → early deployment |
| Voltage support | Reactive power only | Active voltage regulation | 30%+ voltage fluctuation reduction | Deploying |
| Black start capability | Not available | Full black start | Grid restoration without external power | Pilot phase |
| Fault ride-through | Limited | Enhanced | Prevents cascading failures | Standard requirement emerging |
| Oscillation damping | None | Active damping | Eliminates sub-synchronous resonance | Advanced pilots |
6.2 AI-Powered Intelligent Operation
AI technology is optimizing energy storage system scheduling, fault prediction, and lifecycle management. Digital twin technology improves operation and maintenance efficiency, while machine learning algorithms enhance revenue optimization through intelligent trading strategies.
| AI Application | Function | Efficiency Gain | Adoption Status (2025) | Key Providers |
|---|---|---|---|---|
| Battery life prediction | ML-based SOH estimation | 15–25% longer useful life | Early commercial | CATL, Huawei, Fluence |
| Fault early warning | Anomaly detection + thermal prediction | 80%+ fault prevention | Deploying | Tesla, Sungrow, Huijue |
| Revenue optimization | Arbitrage strategy AI | 10–20% revenue increase | Commercial | Fluence, Stem, AutoGrid |
| Digital twin O&M | Virtual replica for monitoring | 30%+ O&M cost reduction | Early adoption | Siemens, GE, Huawei |
| Virtual power plant | Aggregated dispatch | 15–30% additional revenue | Scaling | Tesla, Sonnen, Octopus |
| Silicon carbide (SiC) PCS | Higher efficiency conversion | 30% energy density increase | Early commercial | Infineon, Wolfspeed, Huawei |
7. Potential Risks & Challenges
7.1 Industry Consolidation & Competition Intensification
In 2024, low-price competition led to the exit of small and medium-sized enterprises. In 2025, the market share of the top 10 enterprises may exceed 85%, and companies with backward technology or fragile capital chains face elimination.
| Risk Factor | 2025 Status | Severity | Impact Timeline | Mitigation Strategy |
|---|---|---|---|---|
| Price war (cell <0.4 RMB/Wh) | Ongoing, margins compressed | High | 2025–2026 | Technology differentiation + vertical integration |
| SME market exit | Accelerating | Medium | 2025–2027 | Consolidation opportunities for leaders |
| Top 10 concentration | 80% → 85%+ | Medium | 2025–2028 | Niche market specialization |
| Overcapacity (cell manufacturing) | 2–3x demand | High | 2025–2027 | Capacity rationalization |
| Quality/safety incidents | Isolated but high-profile | High (reputational) | Ongoing | Enhanced BMS + safety standards |
7.2 Policy & Market Mechanism Uncertainty
| Policy Risk | Region | Description | Probability | Business Impact |
|---|---|---|---|---|
| US tariff increase to 25% | United States | Section 301 tariffs on Chinese batteries | High (2026) | Local manufacturing required; margin compression |
| Local content requirements | Middle East, EU | 30–50% local content mandate | Medium-High | Joint ventures + local assembly |
| Dispatching rule changes | China | Incomplete market mechanisms | Medium | Revenue uncertainty for shared storage |
| Peak-valley price compression | China provinces | narrowing spreads as storage grows | Medium | Reduced arbitrage revenue |
| EU battery regulation | European Union | Carbon footprint + recycling mandates | High (2027) | Compliance cost increase |
| Subsidy phase-out | Multiple | ITC stepdown, EU subsidy reduction | Medium | Market must stand alone |
7.3 Technology Bottlenecks & Cost Pressures
| Technology Bottleneck | Current Challenge | 2030 Resolution Pathway | Confidence Level |
|---|---|---|---|
| Sodium-ion vs LFP cost gap | $7/kWh premium in 2025 | Scale manufacturing closes gap by 2027 | High |
| Solid-state mass production | $150–200/kWh, 5–10 GWh capacity | Cost to $50–60/kWh, 500+ GWh by 2030 | Medium |
| Long-duration cost target | $0.30–0.50/kWh LCOS | Below $0.30/kWh needed for 8h+ viability | Medium-High |
| Flow battery scalability | Vanadium cost volatility, limited supply | Iron-based flow + organic electrolytes | Medium |
| Recycling infrastructure | <30% recycling rate globally | 90%+ recycling, closed-loop supply | Medium |
| Safety standards convergence | Fragmented global standards | Unified IEC/UL/GB harmonization | High |
8. Investment Directions & High-Barrier Segments
For investors evaluating the energy storage industry outlook, three categories of investment opportunities stand out for 2025–2030: high-barrier manufacturing segments, technology-leading companies, and emerging long-duration storage tracks.
8.1 High-Barrier Manufacturing: PCS & System Integration
Energy storage power conversion systems (PCS) and system integrators demonstrate stronger profitability and significant premium potential in overseas markets. The global PCS market was valued at approximately USD 3.2 billion in 2024 and is anticipated to reach USD 8.7 billion by 2033.
| Investment Segment | 2025 Market Size | 2030 Projection | Gross Margin | Barriers to Entry | Leading Players |
|---|---|---|---|---|---|
| PCS (inverter/converter) | $4.5B | $8.7B (2033) | 25–35% | Power electronics + grid code expertise | Sungrow, Huawei, Power Electronics |
| System integration | $60B+ | $150B+ | 15–25% | Engineering + supply chain + safety | Fluence, Tesla, Sungrow, BYD |
| BMS & EMS software | $5B | $15B+ | 40–60% | Algorithm + safety certification | CATL, Huawei, Stem |
| Thermal management | $3B | $8B+ | 20–30% | Precision engineering + reliability | Songz, Goaland, Envicool |
| Safety & fire suppression | $2B | $5B+ | 30–40% | Certification + material science | Honeywell, Johnson Controls |
8.2 Technology Leaders: First-Mover Advantages
| Company | Core Strength | 2025 Differentiation | Market Position | Investment Thesis |
|---|---|---|---|---|
| CATL | Battery cells (LFP + Na-ion) | 587Ah cell, 12,000 cycle life | #1 global cell supplier | Scale + technology leader |
| Huawei | Grid-forming + intelligent PCS | SiC PCS, AI EMS | #1 PCS in China | Grid-forming technology moat |
| Sungrow | System integration + PCS | 8.8 MWh container, global footprint | #1 system integrator | Vertical integration + brand |
| BYD | Vertical integration (cell→system) | Blade battery, Na-ion blade | #2 global cell + system | Cost leadership + diversification |
| Envision Energy | Smart storage + AI | CTS integration, digital twin | Top 5 integrator | AI + software differentiation |
| HiNa/BYD (Na-ion) | Sodium-ion pioneer | Mass production 2025–2026 | Na-ion leader | Next-gen chemistry first-mover |
8.3 Long-Duration Storage: Policy-Supported Emerging Track
| LDS Technology | 2025 Investment Stage | Policy Support | 2030 Market Potential | Key Risk | Recommended Strategy |
|---|---|---|---|---|---|
| Vanadium flow battery | Series B–C funding | China subsidies + US DOE grants | $10–15B | Vanadium price volatility | Long-term strategic position |
| Compressed air (CAES) | Project financing | China demonstration projects | $5–8B | Site-specific geography | Selective project investment |
| Iron-air battery | Series A–B | US DOE ARPA-E funding | $3–5B | Technology maturity | Early-stage venture |
| Thermal storage | Growth equity | EU + Middle East pilots | $8–12B | Application-specific design | Platform investment |
| Gravity storage | Series A | Limited, pilot-stage | $1–3B | Unproven at scale | Watch-and-wait |
9. Huijue’s Position in the Energy Storage Value Chain
As the energy storage industry evolves toward high-quality development, Huijue Group occupies a strategic position across multiple segments of the value chain, offering integrated solutions from cabinet energy storage to containerized systems for diverse global markets.
| Huijue Product Line | Application Segment | Key Technology | Target Market | Competitive Advantage |
|---|---|---|---|---|
| Cabinet Energy Storage | C&I (commercial & industrial) | Liquid cooling, modular design | Europe, Africa, Southeast Asia, Middle East | Compact footprint, flexible expansion |
| Container Energy Storage | Utility-scale + large C&I | 20ft container, 5+ MWh | Middle East, Africa, Southeast Asia | Turnkey deployment, grid-forming ready |
| Telecom Power Solution | Telecom base stations | Hybrid PV+storage+grid | Africa, Southeast Asia, Middle East | Remote site reliability, diesel displacement |
| Residential Energy Storage | Home energy management | Stackable LiFePO4 modules | Europe, Australia, Southeast Asia | Modular design, smart monitoring |
9.1 Alignment with Industry Trends
| Industry Trend | Huijue Response | Product Integration | Market Positioning |
|---|---|---|---|
| Large-capacity cells (500Ah+) | Adopting 314Ah→587Ah cells | Cabinet + container systems | Technology follower (fast adopter) |
| Sodium-ion commercialization | Monitoring + pilot integration | Future product roadmap | Ready for chemistry switch |
| Grid-forming capability | Container systems | Emerging markets grid support | |
| AI-powered O&M | Smart monitoring platform | All product lines | Remote management for export markets |
| Middle East GWh projects | Container solution targeting | 20ft container energy storage | Cost-competitive turnkey |
| Africa telecom+storage | Hybrid power solution | Telecom power solution | Diesel displacement leader |
10. Future Outlook: 2030 and Beyond
The energy storage industry will maintain its “hot” trajectory through at least 2030, but the growth model fundamentally shifts from extensive expansion to technology-driven, market-refined operations. Companies with core technologies and global deployment capabilities will dominate the market.
10.1 Market Size Projections
| Year | Global New Installs (GW) | Global New Installs (GWh) | Market Size (USD) | Key Milestone |
|---|---|---|---|---|
| 2025 | 92–112 | 247–290 | $295B | Crossing 100 GW annual threshold |
| 2026 | 123 | 360 | $330B | 33% YoY growth continues |
| 2027 | 155 | 470 | $365B | Na-ion reaches 10% market share |
| 2028 | 185 | 580 | $400B | Solid-state enters commercial storage |
| 2029 | 215 | 690 | $435B | Grid-forming becomes standard |
| 2030 | 250+ | 800+ | $465B+ | China cumulative 220 GW |
10.2 Key Variables Shaping the 2030 Landscape
| Key Variable | Optimistic Scenario | Base Case | Pessimistic Scenario | Probability Weight |
|---|---|---|---|---|
| Policy support intensity | Accelerating (subsidy + market reform) | Maintained (stable support) | Declining (subsidy cuts, trade barriers) | Base case 60%, Optimistic 25% |
| Technology cost reduction | Faster than expected (Na-ion + solid-state breakthroughs) | 15–20% annual decline | Slowing (bottlenecks in new chemistry) | Base case 55%, Optimistic 30% |
| Power market reform | Full market participation globally | Gradual liberalization | Fragmented, slow progress | Base case 50%, Optimistic 30% |
| Supply chain stability | Diversified, resilient | China-dominated but stable | Geopolitical disruption | Base case 55%, Pessimistic 25% |
| Safety standards | Global harmonization achieved | Regional standards coexist | Major incident causes regulatory backlash | Base case 65%, Optimistic 20% |
10.3 Strategic Recommendations for Industry Participants
| Stakeholder | 2025–2027 Priority | 2027–2030 Priority | Key Success Factor |
|---|---|---|---|
| Equipment manufacturers | Scale up + cost reduction | Technology differentiation (Na-ion, grid-forming) | R&D investment + global certifications |
| System integrators | Geographic expansion + vertical integration | Software + AI platform value capture | Engineering capability + local partnerships |
| Project developers | Pipeline acquisition + permitting | Revenue stack optimization + asset management | Market access + financial structuring |
| Investors | High-barrier segment positioning | Consolidation opportunities + emerging tech | Due diligence + technology assessment |
| End users (C&I) | Storage deployment for savings | VPP participation + energy community | ROI analysis + vendor selection |
| Policymakers | Market mechanism design | Standards harmonization + long-duration support | Stakeholder coordination + long-term vision |
FAQ
What is the global energy storage market size in 2025?
The global energy storage market is estimated at USD 295 billion in 2025, with annual deployments reaching 92–112 GW / 247–290 GWh (excluding pumped hydro). BloombergNEF projects growth to 123 GW / 360 GWh in 2026, and the market is expected to reach USD 465 billion by 2030.
Will the energy storage industry continue to grow through 2030?
Yes. Industry analysts expect sustained rapid growth through at least 2030. China’s cumulative new energy storage capacity may reach 220 GW by 2030, with total industry output exceeding 3 trillion yuan. The growth model is shifting from scale expansion to technology-driven, high-quality development.
What are the key technology trends in energy storage for 2025-2030?
Key trends include: large-capacity battery cells (500Ah+), 4-hour+ long-duration storage, sodium-ion battery commercialization (cost ~$59/kWh in 2025), solid-state battery production scaling, grid-forming energy storage (7 GW penetration in 2025), and AI-powered intelligent operation and maintenance.
Which regions offer the best energy storage investment opportunities?
China leads with 110+ GWh source-grid side installations in 2025; the US sees 45+ GWh from pre-tariff rush installations; Europe grows 60%+ led by Germany and Spain; the Middle East emerges as the world’s fourth-largest market with GWh-scale projects in Saudi Arabia and the UAE.
What are the main risks in the energy storage industry?
Key risks include industry consolidation (top 10 companies may control 85%+ market share), policy uncertainty (incomplete dispatching rules, US tariff changes), technology bottlenecks (sodium-ion constrained by lithium price fluctuations, high solid-state mass production costs), and the need for long-duration storage costs to fall below 0.3 yuan/kWh.
Is sodium-ion battery ready for commercial energy storage?
Sodium-ion batteries are entering commercial deployment in 2025. Major manufacturers like BYD and CATL have launched dedicated energy storage products. The 2025 average cost is approximately $59/kWh versus $52/kWh for LFP, but sodium-ion offers superior safety and low-temperature performance. Analysts expect it to become the preferred chemistry for stationary storage as costs converge.
Ready to Capitalize on the Energy Storage Boom?
Whether you’re planning a utility-scale container project or a C&I cabinet installation, Huijue Group delivers turnkey energy storage solutions tailored to your market and application.
👉 Contact Huijue Group for a customized energy storage proposal
👉 Explore our full product range for cabinet, container, telecom, and residential solutions
Article by Huijue Group — Leading manufacturer of C&I cabinet energy storage, containerized BESS, telecom power solutions, and residential energy storage systems. Serving 170+ countries across Europe, Africa, Southeast Asia, the Middle East, and the Americas.