
 chinahuijue@gmail.com
 +1 (702) 204-9855
PV Payback Period: Complete 2026 Guide for 6 Solar Project Types
The photovoltaic payback period — how long it takes for a solar project to recoup its initial investment — is the single most important metric for anyone considering solar. But the answer varies dramatically depending on what type of project you’re building and where you’re building it. A residential rooftop in California might pay back in 5 years, while a community solar project in the UK could take 15.
This guide breaks down payback periods for six distinct PV project types, complete with regional data, cost breakdowns, and actionable strategies to accelerate your return on investment. If you’re evaluating a complete solar power system, understanding these payback timelines is your essential first step.
Quick Answer: PV Payback Periods at a Glance
| PV Project Type | Typical Payback | Annual ROI | Speed |
|---|---|---|---|
| Residential Rooftop | 5–10 years | 8–12% | Medium |
| Commercial & Industrial | 3–7 years | 10–15% | Fast |
| Utility-Scale Farm | 6–10 years | 6–10% | Medium |
| Community Solar | 6–20 years | Variable | Variable |
| Agrivoltaics | 4–8 years | Dual income | Fast |
| Floating PV | 3–5 years | 12–18% | Fast |
1. What Is the PV Payback Period?
The PV payback period measures the time required for a solar project to recover its initial investment through accumulated cash flow — energy savings, electricity sales, and subsidies, minus operational costs.
Example: A 10 kW residential system costing $25,000 (after incentives) that saves $3,200/year on electricity has a payback period of 7.8 years. After year 8, every dollar saved is pure profit for the remaining 17+ years of system life.
2. Six PV Project Types and Their Payback Periods
2.1 Residential Rooftop PV
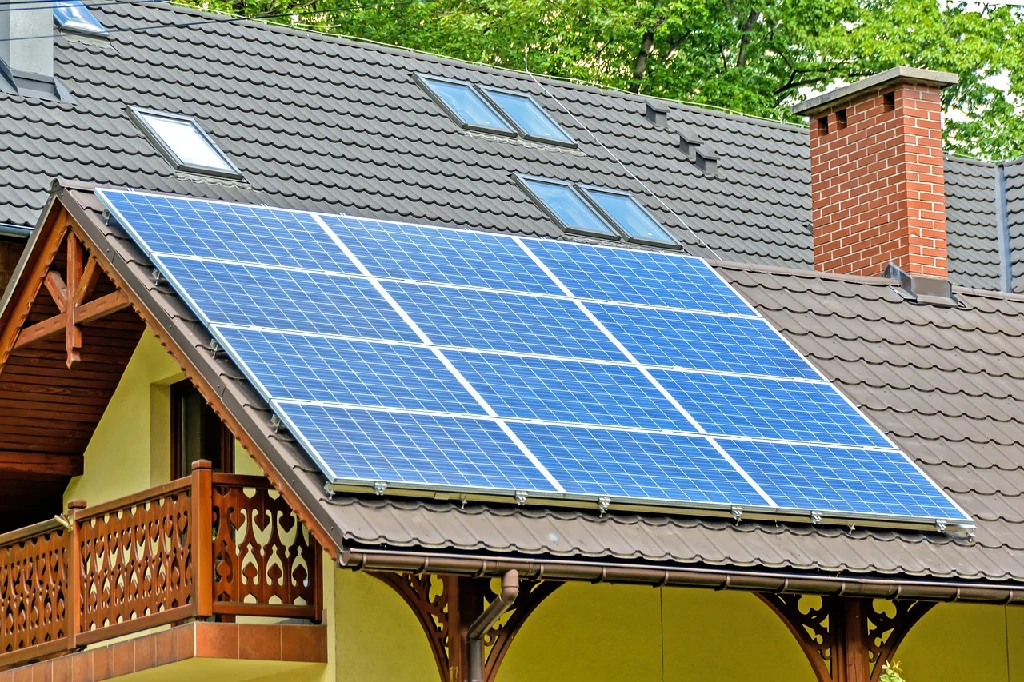
Home solar systems (3–15 kW) mounted on residential rooftops. Payback depends heavily on local electricity rates, incentive programs, and net metering policies.
| Region | Typical System Size | Cost (After Incentives) | Annual Savings | Payback Period |
|---|---|---|---|---|
| USA (California) | 6–8 kW | $18,000–$25,000 | $2,800–$4,000 | 5–7 years |
| USA (Texas) | 8–10 kW | $22,000–$30,000 | $2,200–$3,000 | 8–10 years |
| Germany | 8–10 kW | €12,000–€18,000 | €1,200–€1,800 | 7–9 years |
| UAE / Dubai | 5–8 kW | AED 40,000–60,000 | AED 6,000–9,000 | 5–7 years |
| China | 5–10 kW | ¥25,000–¥40,000 | ¥3,000–¥5,000 | 6–8 years |
| Australia | 6–8 kW | A$8,000–12,000 | A$1,500–2,200 | 4–6 years |
In China, residential PV typically achieves an annual ROI of 8–10%, with payback periods of 6–8 years. High-electricity-price regions with strong incentives consistently deliver the fastest returns.
2.2 Commercial & Industrial (C&I) Rooftop PV
Business installations on warehouses, factories, and office buildings (50 kW–5 MW). C&I projects benefit from economies of scale, peak-demand charge reductions, and accelerated depreciation.
| Metric | Small C&I (50–200 kW) | Medium C&I (200 kW–1 MW) | Large C&I (1–5 MW) |
|---|---|---|---|
| Cost per Watt | $2.0–$2.8 | $1.5–$2.2 | $1.2–$1.8 |
| Annual ROI | 10–13% | 12–15% | 13–16% |
| Payback Period | 5–7 years | 4–6 years | 3–5 years |
| Key Driver | Peak shaving | Net metering + tax | PPA + depreciation |
In California, commercial projects typically achieve payback in 3–5 years due to high demand charges and the federal Investment Tax Credit (ITC). Non-profit organizations without tax liability may see slightly longer periods of 4–7 years.
2.3 Utility-Scale PV Farms
Large ground-mounted installations (10 MW–1 GW+) selling electricity via Power Purchase Agreements (PPAs). Despite massive upfront costs, the low cost per kilowatt-hour makes these projects attractive to institutional investors.
| Region | Typical LCOE | PPA Price | Payback Period |
|---|---|---|---|
| Middle East (Saudi/UAE) | $0.015–0.025/kWh | $0.02–0.04/kWh | 6–8 years |
| China | $0.025–0.035/kWh | $0.04–0.06/kWh | 6–8 years |
| India | $0.030–0.040/kWh | $0.04–0.05/kWh | 7–9 years |
| USA (Sunbelt) | $0.030–0.045/kWh | $0.04–0.07/kWh | 7–10 years |
| United Kingdom | $0.055–0.075/kWh | $0.07–0.09/kWh | 10–12 years |
| Africa (Kenya/South Africa) | $0.035–0.050/kWh | $0.05–0.08/kWh | 6–9 years |
Resource-rich countries with abundant sunlight and supportive regulatory frameworks consistently deliver payback periods of 6–8 years. Regions with weaker solar resources and reduced subsidies, such as the UK, may see extended payback periods of 10–12 years.
2.4 Community Solar
Shared solar installations (100 kW–5 MW) allowing multiple participants — households, small businesses, and renters — to invest and share profits without owning rooftop space.
| Model | Subscription | Credit Mechanism | Payback (Participant) | Payback (Developer) |
|---|---|---|---|---|
| Ownership model | Buy panels upfront | Virtual net metering | 8–15 years | 5–8 years |
| Subscription model | Monthly payment | Bill credits at discount | Immediate savings | 6–10 years |
| Low-income model | Subsidized/free | Direct bill reduction | Immediate savings | 8–15 years |
Community solar payback periods vary widely — from 6 to 20 years — depending on local electricity prices, subsidy structures, and participation agreement terms. The subscription model offers immediate savings but lower long-term returns.
2.5 Agrivoltaics (Solar + Agriculture)
Solar panels installed above or between crops, enabling dual income from agriculture and electricity generation. The shading effect can also improve crop yields for certain plants.
| Crop Type | Panel Height | Shading Effect | Crop Yield Impact | Payback Period |
|---|---|---|---|---|
| Leafy greens | 2–2.5 m | 30–40% shade | +5–10% (cooler) | 4–6 years |
| Grapes/Vineyards | 2.5–3 m | 20–30% shade | Neutral to +5% | 5–7 years |
| Pasture/grazing | 1.5–2 m | 40–50% shade | +10% (livestock comfort) | 4–6 years |
| Rice/wheat | 3–4 m | 15–25% shade | −5–10% (light reduction) | 6–8 years |
Agrivoltaics generally achieve payback periods of 4–8 years — shorter than standalone solar — because the dual revenue stream (agricultural + electricity income) offsets installation costs. Japan, China, and European countries lead agrivoltaic deployment.
2.6 Floating PV (Floatovoltaics)
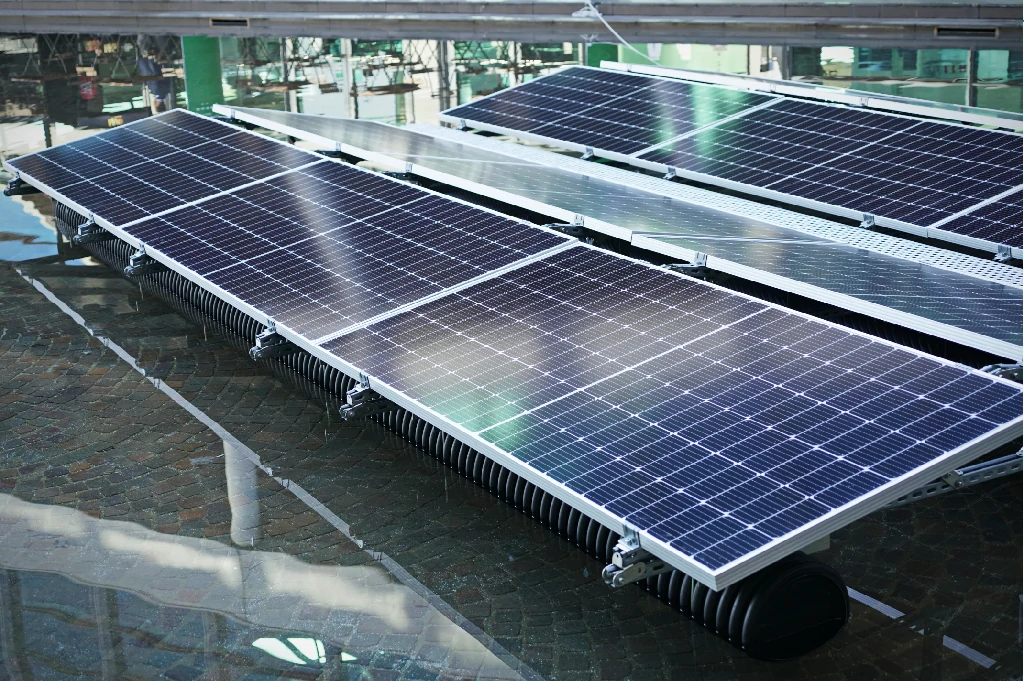
Solar panels mounted on water bodies — reservoirs, lakes, and hydroelectric dams. The cooling effect of water improves panel efficiency by 5–10%, while eliminating land acquisition costs.
| Advantage | Quantified Benefit | Impact on Payback |
|---|---|---|
| Cooling effect | +5–10% efficiency | −0.5 to −1 year |
| No land cost | Save $0.1–0.3/W | −0.5 to −1 year |
| Reduced evaporation | 30–60% less water loss | Additional environmental value |
| Easier maintenance | Less dust accumulation | −0.3 year (lower O&M) |
Floating PV has an energy payback period (from an energy investment perspective) of approximately 1.3 years — the fastest of all PV types. The economic payback period typically ranges from 3 to 5 years, making it one of the most attractive solar investment categories.
3. Five Key Factors Affecting Payback Period
| Factor | Impact on Payback | Quantified Effect | Best-Case Scenario |
|---|---|---|---|
| Solar resource | Higher irradiance = more generation | +1 kWh/m²/day → −0.5 to −1 year | Middle East, North Africa, Australia |
| Electricity prices | Higher rates = greater savings | $0.05/kWh increase → −1 to −2 years | California, Germany, Japan |
| Subsidies & incentives | Lower net investment cost | 30% ITC → −2 to −3 years | USA (ITC), China (feed-in tariff) |
| System scale | Economies of scale lower $/W | 10× scale → −15–25% cost | Utility-scale, large C&I |
| Storage integration | Higher self-consumption, higher cost | +battery: −0–2 years net* | Time-of-use rate regions |
*Storage integration: While batteries add 30–50% to upfront cost, they increase self-consumption from 30% to 70%+ and enable peak-hour energy arbitrage. Net payback impact depends on electricity price spread between peak and off-peak hours.
4. Cost Breakdown: Where Does the Money Go?
Understanding cost components helps identify optimization opportunities. Here’s a breakdown for a typical 8 kW residential system:
| Component | Cost (USD) | Share (%) | Cost-Reduction Potential |
|---|---|---|---|
| Solar panels (PV modules) | $10,400 | 40% | Choose Tier-1 panels at competitive pricing |
| Inverter (string or micro) | $2,600 | 10% | String inverters for simple roofs; micro for complex |
| Mounting & racking | $2,080 | 8% | Roof-type dependent |
| Battery storage (optional) | $5,200–$10,400 | 20–40% | Size to evening consumption only |
| Installation labor | $3,900 | 15% | Local installer = lower travel costs |
| Permits & inspection | $780 | 3% | Varies by jurisdiction |
| Electrical (wiring, breakers) | $1,300 | 5% | Standardized components |
| Total (without battery) | $21,060 | 100% | |
| Total (with battery) | $26,260–$31,460 |
As panel costs have dropped 90% over the past decade, the economics of solar increasingly depend on balance-of-system costs, electricity rate structures, and storage integration rather than panel prices alone.
5. Global PV Subsidy & Incentive Comparison
| Country | Key Incentive | Incentive Value | Payback Impact |
|---|---|---|---|
| USA | Federal ITC (30%) | 30% of system cost | −2 to −3 years |
| Germany | Feed-in tariff (EEG) | €0.08–0.12/kWh (20-year) | −1 to −2 years |
| China | Provincial subsidies + green certificates | ¥0.05–0.15/kWh | −1 to −2 years |
| Japan | FIT (gradually declining) | ¥16–21/kWh | −1 to −2 years |
| Australia | STC (Small-scale Technology Certificates) | ~A$3,000–4,000 (8 kW) | −2 years |
| UAE | Net metering + Shams Dubai | No upfront subsidy, retail-rate credits | −1 year |
| India | PM Surya Ghar (residential) | ₹30,000–78,000 subsidy | −2 to −3 years |
| UK | SEG (Smart Export Guarantee) | £0.04–0.07/kWh export | −0.5 year |
6. Six Strategies to Shorten Your PV Payback Period
| Strategy | How It Works | Payback Impact | Difficulty |
|---|---|---|---|
| Maximize incentives | Stack federal, state, and local rebates; apply for all eligible programs | −2 to −3 years | Low (paperwork) |
| Optimize self-consumption | Shift loads to daytime: EV charging, water heating, appliances | −0.5 to −1.5 years | Low (behavioral) |
| Right-size your system | Match capacity to actual consumption — oversized systems waste money | −0.5 to −1 year | Medium (analysis) |
| Add storage strategically | Size battery for evening consumption only, not full backup | −0 to −1 year (net)* | Medium (design) |
| Choose high-efficiency panels | Tier-1 monocrystalline PERC/TOPCon panels generate more per m² | −0.3 to −0.5 year | Low (product choice) |
| Negotiate installation | Get 3+ quotes; local installers often beat national chains | −0.5 to −1 year | Low (shopping) |
*With time-of-use pricing and peak rates 2× off-peak, storage can reduce payback by 1 year through peak-hour arbitrage. Without TOU rates, storage typically extends payback by 1–2 years.
7. 25-Year ROI Projection: 3 Scenarios
Assuming an 8 kW residential system at $25,000 with annual savings of $3,200:
| Year | Conservative (2% annual savings growth) | Base Case (4% growth) | Aggressive (6% growth + 1% degradation) |
|---|---|---|---|
| 5 | $16,640 | $17,280 | $17,940 |
| 10 | $35,060 (break-even Y7.5) | $37,400 (break-even Y7) | $39,900 (break-even Y6.5) |
| 15 | $55,300 | $60,700 | $66,200 |
| 20 | $77,300 | $86,900 | $96,500 |
| 25 | $101,100 | $116,400 | $131,200 |
| Lifetime ROI | 304% | 366% | 425% |
8. Real-World Case Studies
Case 1: California Residential — 6 kW System
| Parameter | Value |
|---|---|
| System cost (before ITC) | $21,000 |
| Net cost (after 30% ITC) | $14,700 |
| Annual savings (TOU rate) | $2,800 |
| Payback period | 5.3 years |
| 25-year net profit | $55,300 |
Case 2: Germany Commercial — 200 kW Warehouse
| Parameter | Value |
|---|---|
| System cost (after EEG) | €240,000 |
| Annual savings + export income | €48,000 |
| Payback period | 5.0 years |
| 20-year guaranteed FIT | €0.092/kWh |
Case 3: UAE Utility-Scale — 100 MW Farm
| Parameter | Value |
|---|---|
| Total project cost | $70 million |
| PPA price | $0.024/kWh |
| Annual revenue | $9.1 million |
| Payback period | 7.7 years |
| 25-year net profit | $157 million |
FAQ
Q1: What is a good PV payback period?
A good payback period is 5–8 years for residential systems and 3–6 years for commercial projects. Anything under 5 years is excellent; over 12 years may indicate poor project economics unless offset by very long system life or strategic value.
Q2: Do solar panels really pay for themselves?
Yes. With panel lifespans of 25–30 years and typical payback periods of 5–10 years, a solar system generates 15–25 years of “free” electricity after recouping the initial investment. Most systems produce 2.5–4× their cost in lifetime savings.
Q3: How does adding battery storage affect the payback period?
Battery storage adds 30–50% to upfront cost but increases self-consumption from 30% to 70%+. In regions with time-of-use pricing (peak rates 2× off-peak), storage can reduce payback by 1 year through peak-hour arbitrage. Without TOU rates, storage typically extends payback by 1–2 years but provides backup power value.
Q4: Which PV project type has the fastest payback?
Floating PV (3–5 years) and large C&I rooftop systems (3–5 years) typically offer the fastest payback. Floating PV benefits from cooling effects and zero land costs, while large C&I projects leverage economies of scale and peak-demand charge reductions.
Q5: How do subsidies affect the payback period?
Subsidies reduce the net investment cost, directly shortening payback. The US federal ITC (30%) typically reduces payback by 2–3 years. Feed-in tariffs in Germany and Japan provide guaranteed income streams that can reduce payback by 1–2 years. Always research local incentive programs before installation.
Q6: What happens after the payback period?
After payback, the system generates near-free electricity for its remaining 15–20 year lifespan. With O&M costs of only 1–2% of system value annually, post-payback savings represent pure profit. Inverters may need replacement around year 10–15 ($1,000–$3,000), but panels typically retain 85%+ output at year 25.
Planning a Solar Project?
Get expert guidance on system sizing, cost optimization, and payback analysis for your specific region and project type.