
 chinahuijue@gmail.com
 +1 (702) 204-9855
Battery Storage 2026: Sixfold Growth Meets China’s Utilization Pivot
July 31, 2026 | Industry News & Analysis | Huijue Group
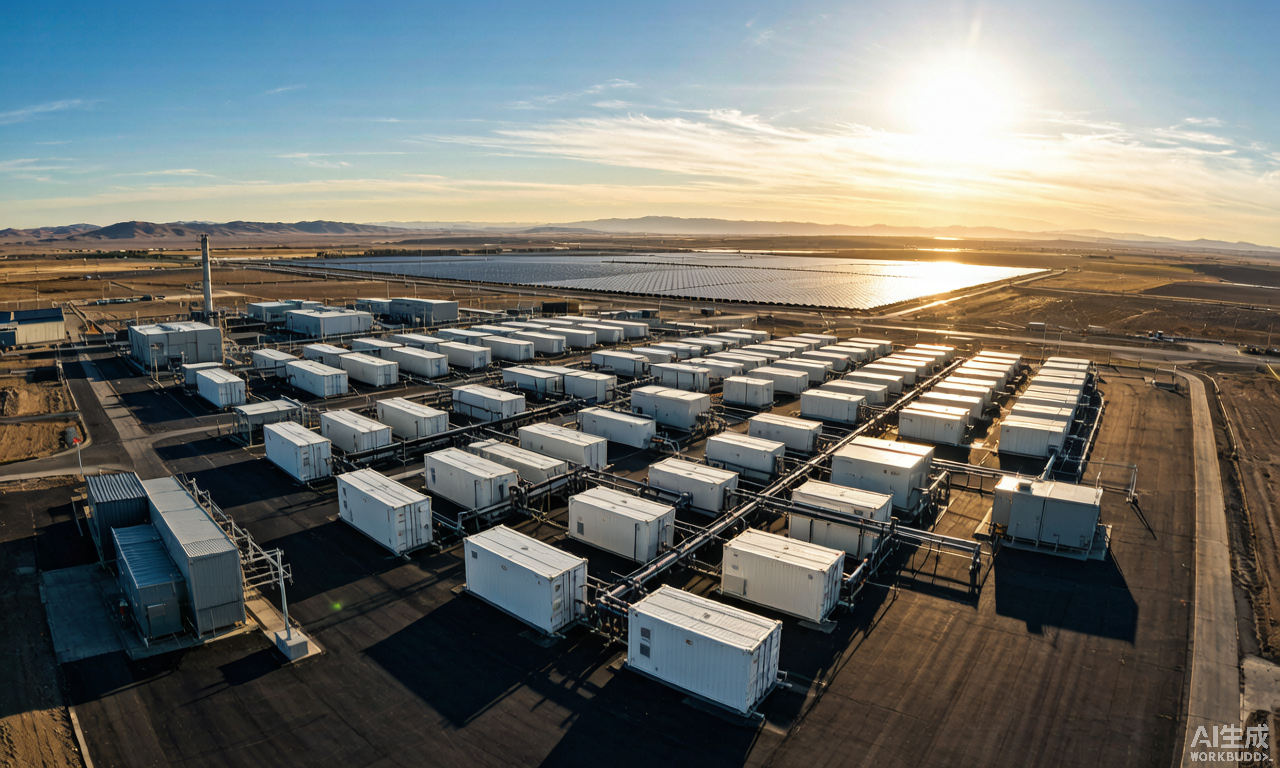
Two reports landed within two weeks of each other in July 2026, and together they frame the defining tension in battery storage right now. GlobalData says installed BESS capacity will hit 1,300 GW by 2030—nearly six times today’s level, growing at 42% a year. Ember, looking at the same industry from a different angle, says China—which holds over half of all that capacity—is quietly walking away from the model that got it there.
The first report is about speed. The second is about what happens after you build. Both matter, but the second may matter more.
1. The Sixfold Forecast
GlobalData’s Strategic Intelligence: Batteries in Power (2026), published July 28, projects global BESS capacity rising from 224.8 GW at the end of 2025 to roughly 1,300 GW by 2030. That is a 42% compound annual growth rate. Battery storage is now the fastest-growing power technology on the planet.
China and the United States together hold 74.6% of installed capacity as of late 2025, and GlobalData expects that duopoly to hold through the forecast period. Australia, Europe, the Middle East, and emerging markets across Southeast Asia and Africa split the remaining quarter.
The 42% CAGR is not a speculative long-term target. The IEA confirmed in June 2026 that global additions reached 108 GW in 2025—a 40% jump from 2024. GlobalData’s projection actually implies slight acceleration, driven by two forces that barely registered three years ago: AI data center demand and maturing standalone storage business models. Lithium-ion pack costs, down over 90% since 2010, continue to fall. Renewable penetration keeps rising, widening the intra-day gap between solar peaks and evening demand. And clean energy mandates—storage procurement targets, capacity markets—are tightening, not loosening.
2. China’s Pivot: Owning Batteries vs. Using Them
Two weeks before GlobalData’s report, the London-based think tank Ember published From Scale to System: Navigating the Next Phase of China’s Battery Storage. The document captures a shift that gets less press than capacity milestones but cuts deeper.
China holds over 50% of global BESS capacity, up from about 20% in 2021. Its first-quarter 2026 lithium-ion storage capacity hit nearly 150 GW—halfway to the 300 GW target in the 15th Five-Year Plan. But the headline number hides a structural change underneath.
| Metric | Pre-2025 (Policy-Driven Era) | 2026 (Market-Driven Era) |
|---|---|---|
| Primary model | Co-located (mandatory add-on to solar/wind) | Standalone (independent market participation) |
| New build mix (Jan–Apr 2026) | Co-located: dominant | Standalone: 84.7% | Co-located: 8.4% |
| Dispatch model | Constrained by host project operations | Grid-operator dispatch; spot market + ancillary services |
| Revenue streams | Single (capacity payment / curtailment avoidance) | Stacked (arbitrage + capacity + ancillary + frequency) |
| Policy trigger | Mandatory co-location requirement | 136 Order (Feb 2025): mandate removed; Jan 2026: capacity compensation extended to standalone |
| Utilization rate | Low; co-located systems cycled ~100 fewer times/year than standalone | Doubled+ from 2022 to 2025; standalone systems lead |
The trigger was Order 136, issued by China’s NDRC and NEA in February 2025. It ended the requirement that new wind and solar projects include mandatory co-located storage. Within months, standalone systems—dispatchable by grid operators, able to participate directly in spot and ancillary markets—surged to 84.7% of new utility-scale installations.
In January 2026, China extended its national capacity compensation mechanism to standalone battery storage. Between 2022 and 2025, utilization rates of utility-scale batteries more than doubled.
“China built the world’s largest battery storage fleet at record speed—but owning batteries is not the same as using batteries. The next phase of China’s storage story will be defined not by how many gigawatts are added, but by how effectively they support the new power system.”
— Biqing Yang, Asia Energy Analyst, Ember
The Gap That Matters
Ember quantified the difference. In 2025, co-located storage systems performed roughly 100 fewer charge-discharge cycles per year than standalone systems. If co-located systems increased their cycling by just 100 cycles annually, they could shift an additional 9.5 TWh of clean electricity. If all systems reached 350 cycles per year—a level already achieved by top-performing standalone projects—the figure rises to 23 TWh. That is about 1.5% of China’s total annual electricity consumption.
| Optimization Scenario | Additional Clean Electricity Shifted | Context |
|---|---|---|
| Co-located systems +100 cycles/year | 9.5 TWh | Closing the standalone vs. co-located gap |
| All systems reach 350 cycles/year | 23 TWh | ~1.5% of China’s annual electricity demand |
The GlobalData forecast says 1,300 GW by 2030. But if utilization rates stay uneven, the effective capacity falls well short of the nameplate. China’s pivot from co-located to standalone suggests the industry is starting to close that gap—not just in China, but globally.
3. Longer Batteries: The 4-Hour Standard
Storage projects are getting longer. The IEA reported that average duration of new battery storage reached roughly 3 hours in 2025, up from 2 hours in 2023. The industry is standardizing around 4-hour systems.
In the US, the California Public Utilities Commission has effectively made 4-hour storage the default for resource adequacy. Texas, expected to account for 53% of new US utility-scale battery installations in 2026, rewards operators who charge during negative-price hours and discharge during net-load peaks—a strategy that favors longer duration.
| US Market Snapshot (2025–2026) | Data |
|---|---|
| 2025 new storage additions | 57.6 GWh (record) |
| Cumulative grid-scale storage | 137 GWh |
| 2026 Q1 installations | 9.7 GWh (+32% YoY, largest Q1 on record) |
| EIA forecast for 2026 | 24 GW of new capacity |
| Domestic cell manufacturing capacity | Nearly 120 GWh |
| Texas share of 2026 installations | 53% | California: 14% | Arizona: 13% |
In the UK, the revenue logic has shifted from frequency response to energy shifting—operators now make more moving bulk energy across price differentials than providing grid services. In the Middle East, tenders explicitly solicit multi-hour storage to integrate massive solar capacity into grids that lack flexible gas generation. For buyers evaluating commercial battery storage, 4-hour systems are becoming the benchmark for capacity credit and resource adequacy.
4. AI Data Centers: A Demand Source That Didn’t Exist Three Years Ago
GlobalData explicitly identifies AI data center electricity demand as a key growth driver. Three years ago, this was not a material factor in BESS demand. Now hyperscale AI campuses need enormous, bursty power loads that strain grid connections, and battery storage fills four roles: peak shaving to avoid exceeding grid connection limits, millisecond-level power quality response for sensitive computing workloads, bridge power between grid loss and diesel generator startup, and energy arbitrage to reduce effective electricity costs.
Major US technology companies have announced plans for tens of gigawatt-hours of battery storage at data center campuses in Texas, Arizona, and Virginia. In China, where data center construction is concentrated in western provinces alongside renewable energy zones, storage is becoming standard in new hyperscale facilities. The trend compounds—it accelerates deployment and pushes system design toward longer durations and higher cycle-life requirements, aligning with the 4-hour standardization and standalone model that Ember describes.
5. Who’s Building What
| Region | 2025 Additions | Key Dynamics |
|---|---|---|
| China | ~63 GW (55 GW utility + 8 GW BTM) | ~60% of global additions; utilization pivot to standalone; 300 GW target by 2030; capacity compensation extended to standalone |
| United States | 19 GW (16+ GW utility, ~3 GW BTM) | ERCOT leads at 53% of 2026 builds; 4-hour standardization; AI data center demand; 24 GW forecast for 2026 |
| Australia | ~8 GW (4.2 GW utility + 3.4 GW BTM) | Nearly 9× growth vs. 2024; behind-the-meter VPPs accelerating; battery storage = 18% of dispatchable capacity |
| Europe | Data not disaggregated | BESS = 4% of dispatchable capacity (vs. China 7%, US 5%, Australia 18%); EU tripartite agreement targets 45 GW by 2028; SolarPower Europe projects 138 GWh by 2030 |
| Middle East & Central Asia | Project pipeline expanding | Masdar’s $1.4B 1 GW wind-solar-storage project in Kazakhstan; multi-hour storage tenders; grid flexibility gap driving demand |
Market share and market maturity are not the same thing. China dominates by volume, but its utilization pivot shows that volume alone falls short. Australia, with battery storage at 18% of dispatchable capacity, has achieved the deepest grid integration despite a smaller footprint. Europe sits at 4%—a gap the EU’s first tripartite energy storage agreement, signed July 2, 2026, targeting 45 GW by 2028, aims to close.
6. What Buyers and Investors Should Watch
For C&I energy buyers, the signals are concrete. Four-hour systems are the new procurement standard—specifying shorter duration risks misalignment with capacity credit requirements and reduced arbitrage capture. China’s 84.7% standalone share validates the revenue-stacking model; when evaluating BESS investments, configurations allowing independent market participation should get priority. And with lithium-ion pack costs down over 90% since 2010, utility-scale BESS system costs now sit in the range of $180–$350 per kWh depending on duration, region, and integration scope. C&I-scale systems typically run higher due to smaller project sizes and more complex integration. For applications like outdoor cabinet energy storage and facility-level peak shaving, 2–4 hour systems represent the sweet spot between cost and capability.
For project developers and investors, nameplate capacity is no longer the primary metric. Cycle frequency, capacity factor, and revenue per kW-month tell you more about project quality. Ember’s data on the 100-cycle gap between co-located and standalone systems is a useful due diligence benchmark. Policy transitions create windows—China’s Order 136 and the extension of capacity compensation to standalone created the conditions for the 84.7% shift. Similar policy changes in other markets will create comparable opportunities. And unlike consumer-electronics-driven battery demand, hyperscaler storage requirements are long-duration, high-cycle, and contract-backed—making them attractive anchor tenants for BESS projects.
FAQ
What is the projected global battery storage capacity by 2030?
GlobalData projects approximately 1,300 GW by 2030, up from 224.8 GW at the end of 2025—a sixfold increase at a 42% CAGR. China and the US together account for 74.6% of the market.
Why is China shifting from co-located to standalone battery storage?
Order 136, issued by China’s NDRC and NEA in February 2025, ended mandatory co-location requirements. Standalone systems can be dispatched independently and participate in spot and ancillary markets. By early 2026, 84.7% of new utility-scale installations were standalone. In January 2026, China also extended capacity compensation to standalone systems.
What is the difference between standalone and co-located battery storage?
Standalone storage operates independently and can be dispatched by grid operators to participate in spot, ancillary, and capacity markets. Co-located storage is attached to a renewable project and constrained by its generation profile. Ember found that co-located systems perform roughly 100 fewer cycles per year.
How much battery storage was added globally in 2025?
The IEA reported 108 GW of new battery storage in 2025, a 40% increase from 2024. China accounted for roughly 63 GW, the US 19 GW, and Australia nearly 8 GW.
Why are battery storage systems shifting from 2-hour to 4-hour duration?
Four-hour systems provide greater capacity credit value, better arbitrage capture, and alignment with resource adequacy requirements. The California Public Utilities Commission has made 4-hour the default standard. Average project duration increased from 2 hours in 2023 to roughly 3 hours in 2025, with 4-hour systems the fastest-growing segment.
Planning Your Battery Storage Project?
Huijue Group designs and manufactures containerized and cabinet BESS solutions for C&I, utility, and telecom applications. Our engineering team can help you evaluate system sizing, duration, and revenue models for your specific market.
Disclaimer: The capacity and cost figures cited in this article are drawn from GlobalData’s “Strategic Intelligence: Batteries in Power (2026)” report (July 28, 2026), Ember’s “From Scale to System” report (July 15, 2026), and IEA data published June 2026. Reference pricing ranges ($180–$350/kWh) are indicative industry estimates based on third-party reports including BloombergNEF and Wood Mackenzie and do not constitute a quote from Huijue Group. Actual system costs vary by project scope, region, duration, and integration requirements. Contact our team for project-specific pricing.