
 chinahuijue@gmail.com
 +1 (702) 204-9855
Commercial Solar Companies: B2B Supplier Selection Guide 2025-2026
Quick Answer
| Question | Answer |
|---|---|
| What is a commercial solar company? | A business that manufactures, installs, or integrates solar energy systems for commercial and industrial (C&I) applications—rooftop, ground-mount, carport, and hybrid solar-plus-storage systems. |
| Top 3 by revenue (2025) | Tongwei ($11.8B), First Solar ($5.2B), LONGi ($4.6B) |
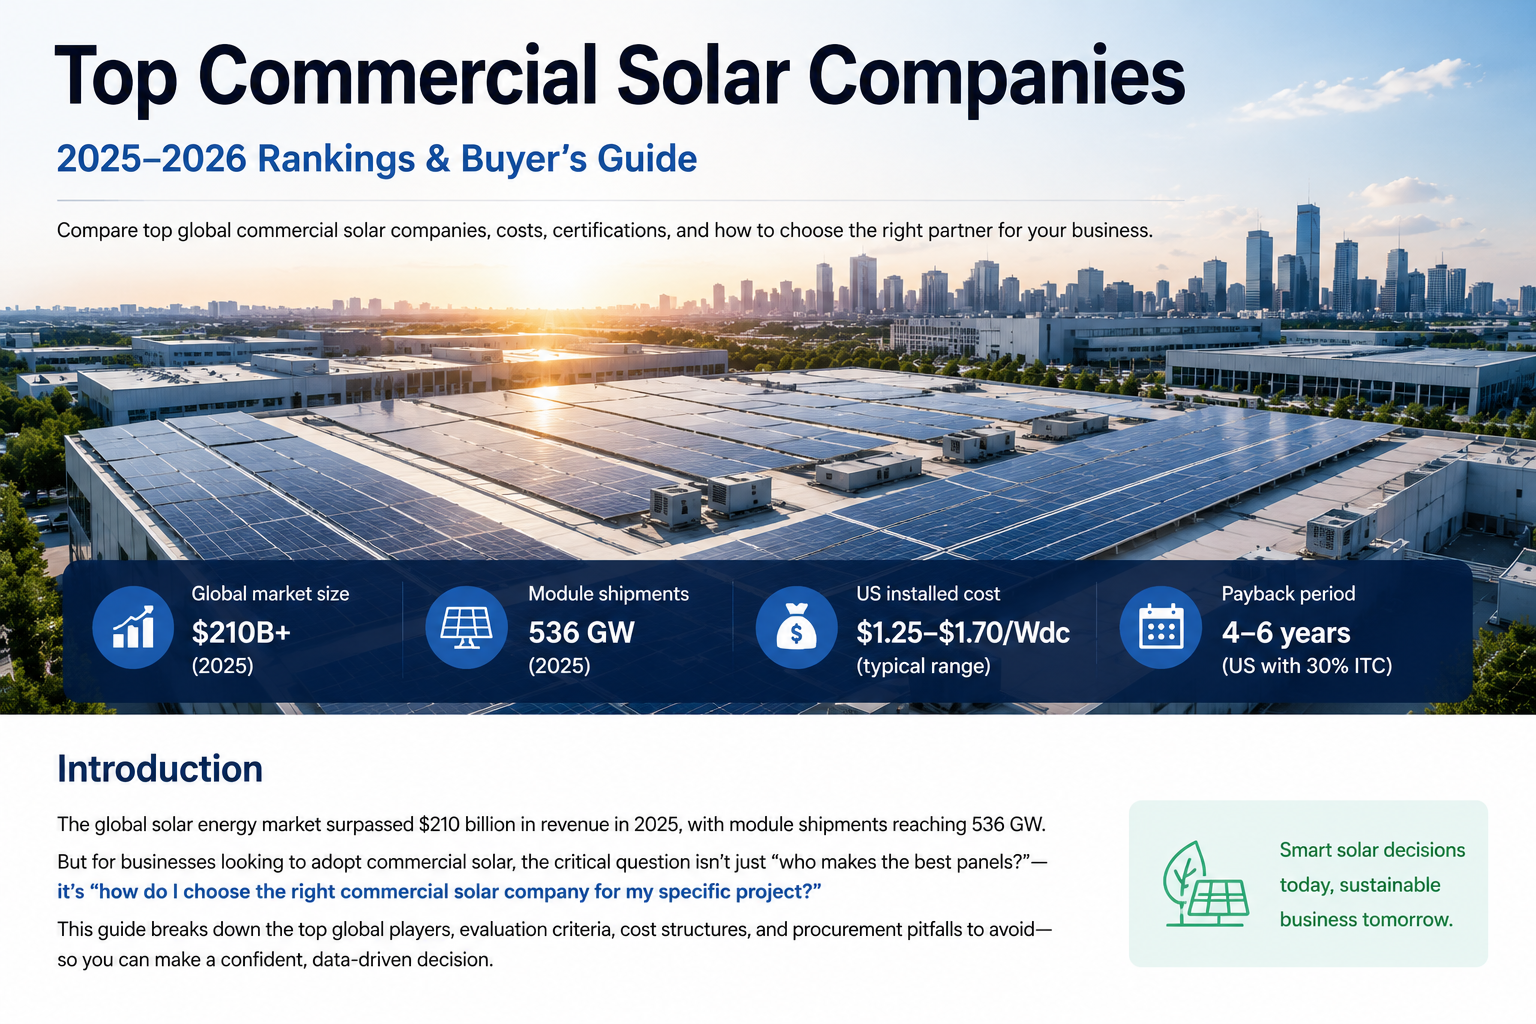
| Commercial solar cost (US) | $1.25–$1.70/Wdc installed; payback 4–6 years with 30% ITC |
| Key certifications | IEC 61215/61730 (global), UL 61730 (US), CE (EU), BIS (India), SASO (Saudi) |
| Most important evaluation factor | Track record + financial stability + certification compliance + warranty terms |
| Global payback range | 2–9 years depending on region, electricity rates, and incentives |
1. What Are Commercial Solar Companies?
Commercial solar companies are businesses that provide solar energy solutions specifically for commercial, industrial, and institutional clients. Unlike residential solar providers, these companies handle larger-scale projects—typically 50 kW to 10+ MW—including warehouse rooftops, factory ground-mounts, parking canopy systems, and microgrid installations.
The commercial solar sector is distinct from both residential (≤20 kW) and utility-scale (≥10 MW) markets. Companies in this space may specialize in one or more of the following:
| Category | Description | Typical Project Size |
|---|---|---|
| Manufacturers | Produce solar panels, inverters, batteries, and mounting systems | N/A (equipment supply) |
| EPC Contractors | Engineering, Procurement, and Construction—full project delivery | 100 kW – 50 MW |
| System Integrators | Design and assemble custom solar + storage solutions | 50 kW – 5 MW |
| Developers | Secure land, permits, PPA agreements, then build and operate | 1 MW – 100+ MW |
| O&M Providers | Operations and maintenance for existing solar assets | Ongoing service contracts |
| Distributors | Wholesale equipment supply to installers and integrators | Bulk equipment supply |
For a comprehensive overview of integrated solar and energy storage products designed for commercial applications, it’s essential to understand which type of company fits your project requirements.
2. Top 15 Global Commercial Solar Companies (2025-2026)
Based on audited financial reports, shipment data from InfoLink Consulting, and industry analysis, here are the world’s leading commercial solar companies by 2025 revenue:
| # | Company | HQ | 2025 Revenue | Module Shipments | Key Strengths |
|---|---|---|---|---|---|
| 1 | Tongwei Solar | China | ~$11.8B | 43.3 GW (modules) 103 GW (cells) |
Largest solar cell producer globally; 30%+ global polysilicon share |
| 2 | First Solar | USA | $5.2B | 17.5 GW | Thin-film CdTe technology; most profitable pure-module maker; US-content compliant |
| 3 | LONGi Green Energy | China | ~$4.6B | 80–90 GW | Monocrystalline wafer leader; BC back-contact (HPBC 2.0) technology |
| 4 | Jinko Solar | China | ~$4.5B | 85–100 GW | #1 by module shipments globally; N-type TOPCon specialist |
| 5 | Trina Solar | China | ~$4.4B | 70–75 GW | Modules + trackers + energy storage (Trina Storage) |
| 6 | Canadian Solar | Canada/China | $5.6B | 24.3 GW + 7.8 GWh storage | Modules + storage + project development pipeline |
| 7 | JA Solar | China | ~$3.4B | 65–70 GW | 98%+ N-type modules; strong cost efficiency |
| 8 | Hanwha Qcells | South Korea | ~$3.0B | 25–30 GW | Non-Chinese supply chain; US premium market positioning |
| 9 | Astronergy (Chint) | China | ~$2.5B | 35–40 GW | Backed by Chint Group’s electrical distribution network |
| 10 | Risen Energy | China | ~$2.2B | 25–30 GW | HJT (heterojunction) technology pioneer |
| 11 | Sungrow | China | ~$3.5B | N/A (inverter focus) | World’s #1 inverter manufacturer; strong in storage |
| 12 | Huawei Digital Energy | China | ~$3.0B (solar segment) | N/A (inverter + smart solutions) | Smart string inverters; AI-driven O&M platforms |
| 13 | Tesla Energy | USA | ~$3.0B (energy segment) | N/A (storage + solar) | Powerpack/Megapack storage; Solar Roof; brand recognition |
| 14 | SolarEdge | Israel | ~$1.5B | N/A (inverter + optimizer) | Power optimizer technology; commercial monitoring platform |
| 15 | Enphase Energy | USA | ~$1.4B | N/A (microinverter) | Microinverter leader; IQ Battery commercial storage |
3. Types of Commercial Solar Companies: Which Do You Need?
Choosing the right type of commercial solar company depends on your project scope, internal capabilities, and risk tolerance. Here’s a detailed comparison:
| Type | What They Do | Best For | Pros | Cons |
|---|---|---|---|---|
| Module Manufacturer | Produces solar panels at factory scale | Large buyers purchasing equipment directly | Lowest equipment cost; direct warranty | No installation; logistics and customs handled by buyer |
| EPC Contractor | Full turnkey: design → procure → build → commission | Companies wanting single-point accountability | One contract; performance guarantee; reduced internal workload | Higher total cost; less control over component selection |
| System Integrator | Custom design + assembly of solar + storage systems | Projects needing hybrid or custom configurations | Tailored solutions; multi-brand optimization | May lack construction capabilities; requires separate installer |
| Developer / IPP | Builds, owns, and operates the system under PPA or lease | Companies wanting solar with zero upfront capital | No CapEx; immediate savings; O&M included | Long-term contract (15-25 years); less ownership benefit |
| O&M Provider | Maintains and optimizes existing solar assets | Asset owners needing professional maintenance | Maximizes uptime; performance analytics; predictive maintenance | Ongoing cost; quality varies widely |
Decision Framework
| Your Situation | Recommended Type | Why |
|---|---|---|
| Large factory, want to own the system | System Integrator + local installer | Custom design at lower cost than full EPC |
| No capital budget, want immediate savings | Developer (PPA model) | Zero upfront cost; pay only for electricity generated |
| Multi-site rollout, need standardization | National EPC contractor | Consistent quality; volume pricing; single point of contact |
| Remote location, diesel replacement | Integrator specializing in off-grid/hybrid | Expertise in microgrid design and storage sizing |
| Buying modules for resale or self-install | Direct from manufacturer or authorized distributor | Best pricing; direct warranty registration |
4. How to Evaluate B2B Solar Suppliers: 7-Point Framework
Whether you’re sourcing modules directly or hiring a full EPC, these seven evaluation criteria separate reliable partners from risky ones:
4.1 Technical Capabilities & Product Quality
| Parameter | What to Check | Benchmark (2025-2026) |
|---|---|---|
| Module efficiency | STC conversion efficiency of flagship product | 22.5–24.5% (N-type TOPCon/HJT) |
| Temperature coefficient (Pmax) | Power loss per °C above 25°C | ≤ -0.29%/°C (premium); ≤ -0.35%/°C (standard) |
| Bifaciality factor | Backside efficiency vs. frontside | ≥80% (bifacial modules) |
| Year-25 performance guarantee | Remaining rated power at year 25 | ≥87.4% (top-tier); ≥85% (standard) |
| Product warranty | Years of manufacturing defect coverage | 12–15 years (standard); 25 years (premium) |
| NMOT rating | Power at Nominal Module Operating Temperature | Closer to real-world conditions than STC |
| Mechanical load rating | Wind/snow load capacity | ≥5400 Pa snow load; ≥2400 Pa wind load |
4.2 Financial Stability
Solar projects last 25–30 years. Your supplier must survive that long. Key indicators:
| Indicator | Green Flag | Red Flag |
|---|---|---|
| Years in business | 10+ years with audited financials | <3 years; no public financial data |
| Annual revenue | >$500M (manufacturer); >$50M (EPC) | Unverified revenue claims |
| Net profitability | Consistent positive net income | 3+ consecutive years of losses |
| Debt-to-equity ratio | <1.5 | >3.0 or rapidly increasing |
| Bankability rating | Tier 1 (BloombergNEF) | Not rated or Tier 3 |
| Public listing | Listed on major exchange (NYSE, SSE, HKEX) | Private with no audit trail |
4.3 Certification Compliance
Certifications vary by target market. The critical rule: do not pay for certifications you don’t need, but never accept products without the required ones.
| Market | Required Certifications | Additional Notes |
|---|---|---|
| United States | UL 61730, FCC | Watch Section 201/301 tariffs + AD/CVD duties |
| European Union | CE, IEC 61215, IEC 61730 | CBAM carbon border tax on Chinese modules from 2026 |
| India | BIS (mandatory) | 4–6 month registration; ~44% total import duties |
| Brazil | INMETRO (retail); IEC (commercial) | PIS/COFINS + ICMS state taxes apply |
| Saudi Arabia | IEC 61215/61730, G-Mark, SASO | Vision 2030: 40GW solar target |
| UAE | IEC 61215/61730, ESMA | High ambient temp → HJT recommended |
| Australia | CEC approved list, AS/NZS 5033/4777 | Must be on CEC list for STC subsidies |
| Canada | UL 61730 or CSA | No AD/CVD on Chinese modules |
| Southeast Asia | IEC base + local (SNI, DOE, etc.) | Varies by country |
| Africa | IEC base + local (NRCS, etc.) | Many countries accept IEC without local cert |
4.4 Manufacturing Capacity & Supply Reliability
| Metric | What to Verify | How to Verify |
|---|---|---|
| Annual production capacity | ≥2 GW for module manufacturers | Company annual report; third-party audit |
| Actual utilization rate | ≥70% (healthy); <50% (potential quality issues) | Industry reports (InfoLink, PV InfoLink) |
| On-time delivery rate | ≥95% | Reference checks with existing customers |
| Vertical integration | Wafer → cell → module (reduces supply risk) | Company website; factory tour video |
| Inventory buffer | 30–60 days of finished goods | Direct inquiry; supplier audit |
4.5 Warranty & After-Sales Support
| Warranty Type | Industry Standard | Premium Tier | Critical Check |
|---|---|---|---|
| Product warranty | 12 years | 25 years | Starts from B/L date, not production date |
| Performance warranty | 25 years, ≥80.7% at year 25 | 30 years, ≥87.4% at year 25 | Linear vs. step degradation curve |
| Inverter warranty | 5–10 years | 10–15 years (extendable) | Local service center availability |
| Battery warranty | 10 years, 6000 cycles | 15 years, 10000+ cycles | Capacity retention guarantee |
| Labor/repair coverage | Not included | Included (parts + labor) | Who pays for shipping of replacements? |
4.6 Track Record & References
| Evidence | Minimum Requirement | Ideal |
|---|---|---|
| Commercial projects completed | 10+ projects of similar size | 50+ projects; case studies available |
| Years of operation | 5+ years | 10+ years with consistent growth |
| Customer references | 3 references in your industry/region | 10+ verifiable references; site visits possible |
| Insurance & bonding | General liability + workers’ comp | Performance bond + product liability |
| Awards & rankings | Industry recognition | Tier 1 (BNEF); Top 10 (PVBL/SolarPower World) |
4.7 Pricing Transparency & Total Cost of Ownership
| Cost Component | % of Total System Cost | What to Scrutinize |
|---|---|---|
| Modules | 30–35% | $/W pricing; Tier 1 vs. Tier 2 premium |
| Inverters | 8–12% | String vs. central; efficiency rating |
| Racking/mounting | 5–10% | Material (aluminum vs. steel); wind load rating |
| Battery storage (if included) | 20–35% | $/kWh; chemistry (LFP vs. NMC); cycle life |
| Installation labor | 15–20% | Local vs. imported labor; prevailing wage |
| Permits & interconnection | 3–8% | Utility connection fees; grid study costs |
| Engineering & design | 3–5% | PE-stamped drawings; structural analysis |
| O&M (annual) | 1–1.5% of CapEx | $10–18/kW/year; included or separate? |
5. Commercial Solar Cost & ROI Analysis by Region
Understanding regional cost structures and return metrics is essential for building a business case. Data below is sourced from NREL, SolarPower Europe, IRENA, and the World Bank.
5.1 Installation Cost Per Watt
| Region | Cost Range ($/Wdc) | Primary Driver | Data Source |
|---|---|---|---|
| United States (C&I rooftop) | $1.25–$1.70 | High labor + permitting costs | NREL 2024 |
| Europe (Spain, Germany) | $0.85–$1.20 | Moderate labor; streamlined permits | SolarPower Europe 2024 |
| Middle East & North Africa | $0.60–$0.90 | Low labor; high solar irradiance | IRENA 2023 |
| India (C&I rooftop) | $0.55–$0.75 | Lowest installed cost globally | CEA 2024 |
| Sub-Saharan Africa | $0.60–$0.80 | Import logistics; limited local capacity | World Bank 2024 |
| China (C&I rooftop) | $0.45–$0.65 | World’s largest manufacturing base | IRENA 2023 |
| South America (Brazil) | $0.70–$1.00 | Import duties; growing local market | IRENA 2023 |
5.2 Payback Period & IRR by Region
| Region | Payback (years) | After-tax IRR | Key Incentive |
|---|---|---|---|
| USA (with 30% ITC) | 4–6 | 10–16% | IRA Investment Tax Credit |
| USA (no ITC) | 7–9 | 7–10% | MACRS depreciation |
| Southern Europe (Spain/Italy) | 5–8 | 9–14% | High retail electricity prices |
| Northern Europe (Germany/UK) | 6–9 | 7–12% | Feed-in tariffs (declining) |
| India (C&I rooftop) | 3–6 | 12–20% | Very low installed cost + high tariffs |
| Sub-Saharan Africa (diesel replacement) | 2–4 | 25–35% | Diesel at $0.25–0.45/kWh vs. solar $0.06–0.12/kWh |
| MENA (subsidized electricity) | 8–12 | 5–9% | Low electricity prices reduce savings |
| Brazil (self-consumption) | 4–7 | 10–18% | Net metering (compensation) |
| China (C&I rooftop) | 4–7 | 9–15% | Low cost + time-of-use price spreads |
| Australia (grid offset) | 3–6 | 12–18% | High demand charges + STC rebate |
5.3 Commercial Electricity Prices (Why Solar Makes Sense)
| Country | C&I Electricity Price | Solar LCOE | Savings Potential |
|---|---|---|---|
| Germany | $0.27–0.38/kWh | $0.04–0.08/kWh | 70–80% reduction |
| United Kingdom | $0.27–0.37/kWh | $0.05–0.09/kWh | 70–78% reduction |
| Spain / Italy | $0.19–0.30/kWh | $0.04–0.07/kWh | 70–77% reduction |
| United States | $0.12–0.15/kWh | $0.04–0.07/kWh | 55–65% reduction |
| South Africa | $0.11–0.17/kWh (rising >15%/yr) | $0.06–0.10/kWh | 40–50% + load-shedding resilience |
| Nigeria (diesel) | $0.25–0.45/kWh | $0.06–0.12/kWh | 60–73% reduction |
| India | $0.085–0.12/kWh | $0.03–0.06/kWh | 50–60% reduction |
| China | $0.08–0.12/kWh | $0.028–0.042/kWh | 55–65% reduction |
5.4 Solar-Only vs. Solar + Storage ROI
| Market | Solar-Only IRR / Payback | Solar + Storage IRR / Payback | Storage Premium |
|---|---|---|---|
| USA California (high demand charges) | 9–13% / 6–8 yr | 11–16% / 5–7 yr | +30–50% CapEx |
| Germany (low feed-in tariff) | 8–12% / 7–9 yr | 10–14% / 6–8 yr | +35–55% CapEx |
| India (TOU + reliability) | 12–18% / 3–5 yr | 14–20% / 3–5 yr (higher NPV) | +30–45% CapEx |
| Africa diesel hybrid | 25–35% / 2–4 yr | 20–30% / 3–5 yr (24/7 power) | +40–60% CapEx |
| Australia (demand charge cut) | 12–18% / 3–6 yr | 14–20% / 3–5 yr | +30–50% CapEx |
6. Common Pitfalls When Choosing Solar Suppliers
After analyzing hundreds of B2B solar procurement cases, these are the most frequent—and costly—mistakes:
6.1 Red Flags Checklist
| # | Red Flag | Why It’s Dangerous | What to Do Instead |
|---|---|---|---|
| 1 | Factory photos identical to Alibaba stock images | Likely a trading company, not a manufacturer | Request live video factory tour; verify business license |
| 2 | No brand-name certifications (only “compatible with”) | Supplier is a middleman; warranty may be void | Demand original certification documents with matching brand name |
| 3 | Instant WhatsApp replies at 3 AM Beijing time | Automated bot or agency, not factory staff | Request call during Chinese business hours (9 AM–6 PM CST) |
| 4 | Price 20%+ below market average | B-grade cells, rejected modules, or scam | Compare against BNEF tier 1 pricing benchmarks |
| 5 | Warranty starts from “production date” not “B/L date” | 3–6 months of warranty consumed in transit/warehousing | Negotiate warranty start from delivery date |
| 6 | No third-party testing for first order | Quality defects discovered after installation | Use SGS/TÜV inspection ($500–$1,200/container); catches 90%+ of defects |
| 7 | Supplier pushes own-brand BOS components (cables, breakers) | May be rebranded low-quality items | Specify branded BOS (e.g., Phoenix Contact, ABB, Schneider) |
| 8 | Unwilling to provide customer references | Poor track record or no real projects | Walk away; demand 3+ references in your region/industry |
6.2 Procurement Risk Matrix
| Risk | Probability | Impact | Mitigation Strategy |
|---|---|---|---|
| Module quality defects (microcracks, PID) | Medium | High (5–15% yield loss) | EL (electroluminescence) imaging before shipment; third-party inspection |
| Supplier bankruptcy during warranty period | Low-Medium | High (no warranty coverage) | Choose Tier 1 manufacturers; check financial health |
| Shipping damage | Medium | Medium (2–5% of modules) | Full insurance; proper packaging; container inspection on arrival |
| Tariff/duty changes post-order | Medium | High (10–25% cost increase) | Lock in pricing with tariff clauses; consider SE Asia manufacturing |
| Currency fluctuation | Medium | Medium (5–10% cost swing) | Use forward contracts; price in USD when possible |
| Performance below guaranteed output | Low | High (lifetime revenue loss) | Performance guarantee in contract; independent commissioning test |
7. Solar + Storage: Why Commercial Buyers Need Both
The commercial solar market is rapidly shifting from solar-only to solar-plus-storage. Here’s why every B2B buyer should consider battery storage alongside their PV system:
| Benefit | Solar Only | Solar + Storage | Business Impact |
|---|---|---|---|
| Peak demand charge reduction | Limited | Strong (discharge during peak) | 30–60% demand charge savings |
| Backup power during outages | None (grid-tied shuts off) | Full or partial backup | Business continuity; no downtime losses |
| Time-of-use arbitrage | None | Charge off-peak, discharge peak | $0.05–0.15/kWh spread captured |
| Self-consumption ratio | 30–50% | 70–90% | Less grid dependency; lower bills |
| Grid services revenue | None | Frequency regulation, capacity markets | Additional revenue stream |
| Energy resilience | Low | High | Critical for regions with unstable grids |
For commercial facilities considering integrated solutions, containerized energy storage systems offer modular, scalable storage that pairs seamlessly with commercial solar arrays. These systems are particularly valuable for industrial sites with high demand charges or unreliable grid infrastructure.
Storage Sizing Guidelines
| Application | Storage Size (relative to PV) | Typical Duration | ROI Driver |
|---|---|---|---|
| Peak shaving (demand charge) | 0.5–1.0 kWh per kW PV | 2–4 hours | Demand charge reduction |
| TOU arbitrage | 1.0–2.0 kWh per kW PV | 4–6 hours | Peak/off-peak price spread |
| Backup power | 2.0–4.0 kWh per kW PV | 8–12 hours | Business continuity value |
| Off-grid / microgrid | 4.0–8.0+ kWh per kW PV | 12–24+ hours | Diesel displacement; energy access |
8. Step-by-Step Procurement Process
Follow this 8-step process to minimize risk and maximize value when procuring commercial solar systems:
| Step | Action | Timeline | Key Deliverable |
|---|---|---|---|
| 1 | Energy audit & load profile analysis | 2–4 weeks | 12-month consumption data; peak demand patterns |
| 2 | Define project scope & budget | 1–2 weeks | System size target; CapEx ceiling; ROI threshold |
| 3 | Shortlist 5–8 qualified suppliers | 1–2 weeks | Supplier scorecard (7-point framework from Section 4) |
| 4 | Issue RFP with technical specifications | 2–3 weeks | Detailed RFP document; site drawings; electrical single-line |
| 5 | Evaluate proposals & negotiate | 3–4 weeks | Shortlist of 2–3 finalists; best-and-final offers |
| 6 | Due diligence: factory audit + reference checks | 2–3 weeks | Audit report; reference call notes; insurance verification |
| 7 | Contract signing (include performance guarantees) | 1–2 weeks | Signed EPC/supply contract; warranty terms; payment schedule |
| 8 | Third-party inspection & commissioning | 1–2 weeks (post-installation) | EL imaging report; performance test results; PTO documentation |
Key Contract Clauses to Include
| Clause | Why It Matters | Standard Term |
|---|---|---|
| Performance guarantee | Ensures system meets guaranteed output | ≥95% of predicted Year-1 yield |
| Liquidated damages | Compensation if performance falls short | $X per kWh below guarantee |
| Warranty start date | Maximizes warranty coverage period | From B/L date or commissioning date (whichever is later) |
| Spare parts guarantee | Ensures replacement parts availability | 10 years minimum |
| Force majeure scope | Clarifies what’s covered in disruptions | Exclude pandemics, trade wars, tariff changes |
| Dispute resolution | Determines jurisdiction for conflicts | International arbitration (SIAC, HKIAC, ICC) |
9. Key Metrics Quick Reference
| Metric | Value (2025-2026) | Source |
|---|---|---|
| Global solar market revenue | $210 billion | Enerdata 2025 |
| Global module shipments | 536 GW | InfoLink Consulting |
| Top 5 manufacturers’ market share | 58% of global shipments | InfoLink / BNEF |
| Global C&I solar LCOE | $0.04–0.10/kWh | Lazard 2024 |
| US commercial solar cost | $1.25–1.70/Wdc installed | NREL 2024 |
| US ITC (Investment Tax Credit) | 30% (base); up to 50% with adders | IRA (Inflation Reduction Act) |
| Typical payback period (global) | 3–8 years (most markets) | NREL, SolarPower Europe, IRENA |
| System lifespan | 25–30+ years | NREL, IEA PVPS |
| Module annual degradation | 0.3–0.6%/year | IEC 61215 testing |
| Annual O&M cost (commercial) | $10–18/kW/year (~1–1.5% of CapEx) | NREL 2024 |
| Battery pack price | $139/kWh (2023); <$80/kWh projected by 2030 | BNEF |
| Diesel generation cost (Africa) | $0.25–0.45/kWh | World Bank 2024 |
Frequently Asked Questions
Q: What is the difference between commercial solar and utility-scale solar?
Commercial solar typically refers to systems sized 50 kW to 10 MW installed on business properties (rooftops, parking structures, ground mounts) for self-consumption. Utility-scale solar refers to large solar farms (10 MW to 1+ GW) that sell electricity to the grid via Power Purchase Agreements (PPAs). The procurement process, financing, and supplier types differ significantly between the two.
Q: How much does a commercial solar system cost in 2025-2026?
Costs vary by region: $1.25–$1.70/Wdc in the US, $0.85–$1.20/Wdc in Europe, $0.55–$0.75/Wdc in India, and $0.60–$0.90/Wdc in the Middle East and Africa. A typical 500 kW commercial rooftop system in the US costs approximately $625,000–$850,000 before the 30% ITC, bringing the net cost to $437,500–$595,000.
Q: How long is the payback period for commercial solar?
Payback periods range from 2–4 years in diesel-dependent regions (Sub-Saharan Africa) to 4–6 years in the US (with 30% ITC), 5–8 years in Southern Europe, and 8–12 years in MENA countries with subsidized electricity. The global average for most commercial markets is 3–8 years.
Q: What certifications should I look for when buying solar panels internationally?
The baseline certifications are IEC 61215 (design qualification) and IEC 61730 (safety). For the US market, UL 61730 and FCC are required. For the EU, CE marking is mandatory. India requires BIS certification. Saudi Arabia requires G-Mark and SASO in addition to IEC. Australia requires CEC listing. Always verify that certifications are issued to the manufacturer’s own brand name, not a trading company’s.
Q: Should I add battery storage to my commercial solar system?
If your facility has high demand charges ($10+/kW), time-of-use electricity pricing, frequent power outages, or low feed-in tariffs, adding storage is likely worthwhile. Storage increases CapEx by 30–60% but can boost IRR by 2–5 percentage points in the right market. For facilities with critical loads (data centers, manufacturing, healthcare), storage provides essential backup power that solar alone cannot deliver.
Q: How do I verify a solar supplier is a real manufacturer and not a trading company?
Four key verification steps: (1) Request a live video factory tour during Chinese business hours (9 AM–6 PM CST) to see the production line in operation. (2) Check the business license for manufacturing scope, not just trading. (3) Verify that product certifications are issued under the manufacturer’s brand name. (4) Use third-party inspection services (SGS, TÜV) for the first container—costs $500–$1,200 but catches 90%+ of quality issues.
Q: What is a Tier 1 solar panel manufacturer?
Tier 1 is a classification by Bloomberg New Energy Finance (BNEF) based on the manufacturer’s bankability—specifically, which non-recourse debt-financed projects have used their panels in the past two years. Tier 1 status indicates financial stability and makes project financing easier. However, Tier 1 is about financial health, not necessarily product quality. Always combine Tier 1 status with independent quality testing.
Q: What warranties should I negotiate in a commercial solar contract?
At minimum: 12-year product warranty (25 years for premium), 25–30 year linear performance guarantee (≥87.4% at year 25), 10-year inverter warranty (extendable to 15–20 years), and 10-year battery warranty (6,000+ cycles, ≥70% capacity retention). Critical: ensure warranty starts from the bill of lading (B/L) date or commissioning date, not the factory production date. Include labor coverage for warranty replacements.
Ready to Find the Right Commercial Solar Partner?
Choosing the right commercial solar company can save your business hundreds of thousands of dollars over the system’s 25+ year lifespan. Don’t navigate this alone.
👉 Contact our solar experts for a free consultation, or explore our commercial solar and storage products to find the right solution for your project.
Tags: Huijue Group commercial solar companies B2B solar suppliers solar procurement commercial solar ROI solar energy solutions solar panel manufacturers commercial solar installation