
 chinahuijue@gmail.com
 +1 (702) 204-9855
Solar Energy Solutions: B2B Procurement Guide 2025-2026
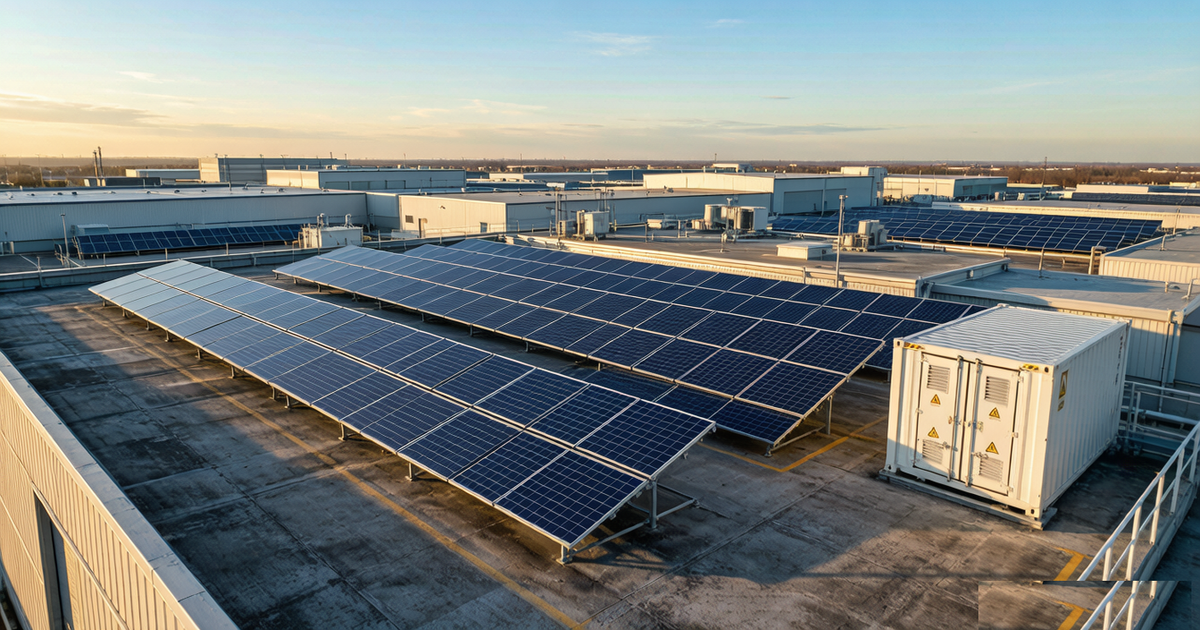
The global solar energy solutions market reached $295 billion in 2025 and is projected to nearly double to $694 billion over the coming decade. For B2B buyers—whether you are an EPC contractor, industrial facility manager, or energy procurement officer—navigating this landscape requires more than comparing panel prices. It demands a structured understanding of system architectures, storage integration, EPC contracting models, financing instruments, and the full procurement lifecycle.
This guide takes a different approach from typical “Top 10 benefits” listicles. Drawing on data from SEIA, Wood Mackenzie, BloombergNEF, IRENA, and leading EPC industry reports, we provide a white-paper-style framework that walks you through what solar energy solutions are, how they are structured, which provider to choose, and how to execute the procurement process from RFQ to commissioning. Whether you are evaluating a commercial solar energy system for a factory rooftop or a multi-megawatt ground-mount with integrated storage, the framework below will help you make bankable decisions.
Executive Summary: Key Insights at a Glance
- Market scale: Global solar energy solutions market valued at $295B (2025), projected to reach $694B—with solar EPC alone representing $259.58B (2026) growing at 5.2% CAGR to $317.6B by 2030.
- Cost benchmark: Commercial solar installation costs $1.40–$1.80/Wdc (2025-2026, SEIA/Wood Mackenzie), with module prices stabilizing at ~$0.30/Wdc while soft costs (labor, permitting, interconnection) continue rising.
- Storage is now standard: Over 63.2% of commercial solar installations (2023-2025) include solar-plus-storage, driven by battery cell costs falling to ~$117/kWh (BloombergNEF 2025).
- ROI window: Typical payback periods of 5-8 years with 25-year ROI of 200-400%, enhanced by 30% ITC (up to 70% with adders) and 100% bonus depreciation.
- Provider landscape: Top 10 global EPC firms collectively account for 125+ GW of installed capacity, led by China Energy Engineering Group (51.42 GW) and SOLV Energy (20 GW).
- Procurement timeline: Full B2B solar procurement cycle spans 6-18 months across 7 stages—from needs assessment through commissioning.
- O&M opportunity: Global solar O&M market generates $15-18 billion annually, growing as installed base approaches 2.35 TW (2025).
1. What Are Solar Energy Solutions? Beyond Panels and Inverters
The term “solar energy solutions” is often misunderstood as simply “solar panels.” In reality, it encompasses the full ecosystem of products, services, and business models that enable an organization to generate, store, manage, and monetize solar electricity. A complete solar energy solution typically integrates five layers:
- Generation layer: PV modules, mounting structures, inverters, and balance-of-system (BOS) components
- Storage layer: Battery energy storage systems (BESS), charge controllers, and energy management software
- Services layer: EPC contracting, engineering design, installation, commissioning, and O&M
- Financial layer: PPA structures, leasing, C-PACE financing, ITC monetization, and insurance
- Digital layer: SCADA monitoring, predictive analytics, demand response integration, and virtual power plant (VPP) participation
For B2B buyers, the distinction matters because each layer involves different vendors, contract structures, and risk profiles. A well-structured solar energy solution aligns all five layers with the buyer’s energy profile, regulatory environment, and financial objectives.
Global Market Overview
| Market Segment | 2025 Value | Projected Value | CAGR | Key Driver |
|---|---|---|---|---|
| Solar Energy Solutions (Total) | $295.0B | $694.0B (2035) | ~8.9% | C&I adoption + storage integration |
| Global Solar Energy Market | $260-308B | $650B+ (2035) | ~15% | Utility-scale + distributed PV growth |
| Solar EPC Market | $259.58B (2026) | $317.6B (2030) | 5.2% | Mega-project pipeline in MENA & Asia |
| Solar O&M Market | $15-18B | $25B+ (2030) | ~7% | Aging installed base approaching 2.35 TW |
| Solar PV Installed Base | 2.35 TW | 2.92 TW (2030) | ~4.4% | 220+ GW annual additions |
Sources: pmarketresearch.com, Emergen Research, Custom Market Insights, The Business Research Company, Mordor Intelligence, Dataintelo (2025-2026)
2. The Five Categories of Solar Energy Solutions
Not all solar energy solutions serve the same purpose. Understanding the five core categories helps B2B buyers identify which combination fits their specific energy strategy.
| Category | What It Covers | Typical Buyer | Contract Model | Key Risk |
|---|---|---|---|---|
| Solar PV Generation | Modules, inverters, mounting, BOS, grid interconnection | Commercial / industrial / utility | Equipment supply + installation | Performance degradation over 25-30 years |
| Energy Storage Integration | BESS sizing, DC/AC coupling, EMS software, demand response | C&I with peak demand charges | Equipment + integration service | Battery lifecycle & replacement cost |
| EPC & Construction | Engineering design, procurement, construction, commissioning | Project developers / asset owners | Lump-sum turnkey / EPC contract | Construction delays & cost overruns |
| O&M and Asset Management | Preventive/corrective maintenance, monitoring, reporting, spares | Asset owners / investors | Long-term service agreement (5-20 yr) | Underperformance vs. guaranteed yield |
| Financing & Risk Management | PPA, leasing, C-PACE, ITC monetization, insurance, warranties | Corporate / municipal / non-profit | PPA / lease / loan / direct pay | Policy changes & interest rate exposure |
Framework adapted from Equans B2B Solar Guide, SolarTech Online, and SafeCloud Power procurement models (2025-2026)
Most B2B solar projects involve at least three of these categories simultaneously. A factory installing a 500 kW rooftop system, for instance, will need generation equipment, EPC services, and likely financing—plus O&M for long-term asset management. The key decision is whether to procure each category separately (multi-contract approach) or bundle them under a single EPC or PPA structure.
3. Solar PV System Architectures: Choosing On-Grid, Off-Grid, or Hybrid
The fundamental architecture decision—on-grid, off-grid, or hybrid—shapes every subsequent design choice, from inverter selection to battery sizing. With containerized energy storage becoming increasingly cost-effective, the hybrid model has emerged as the default for most new commercial installations.
Architecture Decision Matrix
| Criterion | On-Grid (Grid-Tied) | Off-Grid (Stand-Alone) | Hybrid (Grid + Storage) |
|---|---|---|---|
| Grid dependency | Fully dependent—no grid = no power | Fully independent—no grid connection | Connected but can island during outages |
| Battery requirement | None (grid is the “battery”) | Mandatory—typically 2-3 days autonomy | Optional but recommended for arbitrage |
| Cost per watt (2025-2026) | $1.40-$1.80/Wdc | $3.50-$5.00/Wdc (incl. storage) | $1.80-$2.80/Wdc (incl. storage) |
| Best application | Urban C&I with stable grid & net metering | Remote sites, telecom, mining, islands | C&I with demand charges, TOU rates, or backup needs |
| Energy arbitrage | Limited (net metering/billing only) | N/A | Full—charge off-peak, discharge on-peak |
| Market share (new C&I installs) | ~30% | ~7% | ~63% (and growing) |
Cost data: SEIA/Wood Mackenzie Q4 2025, SolarTech Online 2025; Market share: industryresearch.biz (2023-2025 commercial install data)
System Selection Decision Tree
START: Does your site have reliable grid access?
│
├── YES → Does your utility offer net metering or favorable TOU rates?
│   │
│   ├── YES → Do you experience frequent outages or have critical loads?
│   │   │
│   │   ├── YES → HYBRID SYSTEM (Grid + Battery Storage)
│   │   │           → Size battery for critical loads + peak shaving
│   │   │           → Add EMS for automated arbitrage
│   │   │
│   │   └── NO → ON-GRID SYSTEM (Grid-Tied Only)
│   │               → Maximize PV-to-load ratio
│   │               → Consider future storage readiness
│   │
│   └── NO → Are demand charges >30% of your electric bill?
│       │
│       ├── YES → HYBRID SYSTEM (focus on peak shaving)
│       │           → Size battery for demand charge reduction
│       │           → Target 2-4 hour discharge duration
│       │
│       └── NO → ON-GRID SYSTEM (simplest ROI)
│
└── NO → What is your daily energy consumption profile?
    │
    ├── <5 kWh/day → OFF-GRID SYSTEM (Small Stand-Alone)
    │                  → Telecom, remote monitoring, small cabins
    │                  → 3-day battery autonomy minimum
    │
    └── >5 kWh/day → OFF-GRID HYBRID (PV + Battery + Generator)
                       → Industrial sites, mining, agriculture
                       → Generator as backup for multi-day low-solar periods
4. Solar-Plus-Storage: Why 63% of New Commercial Installs Now Include Batteries
The economics of solar-plus-storage have fundamentally shifted. Between 2023 and 2025, over 63.2% of commercial solar installations included battery storage—up from less than 20% in 2020. This transformation is driven by three converging factors:
- Battery cost collapse: Lithium-ion cell prices fell to approximately $117/kWh in 2025 (BloombergNEF), down 89% from $1,100/kWh in 2010. Pack-level costs for commercial BESS now range from $350-500/kWh installed.
- Rate structure evolution: Time-of-use (TOU) pricing and demand charges now account for 30-60% of commercial electric bills in many markets, making peak shaving economically compelling.
- Resilience requirements: Increasing grid instability in emerging markets and climate-driven outage risk in developed markets have made backup power a procurement requirement rather than a nice-to-have.
Solar-Plus-Storage Adoption & Economics
| System Configuration | Battery Size (per kWp PV) | Added Cost | Annual Savings Uplift | Payback Impact |
|---|---|---|---|---|
| Solar only (on-grid) | 0 kWh | Baseline | Baseline | 5-7 years |
| Solar + 2hr storage | 2 kWh/kWp | +$0.40-0.60/Wdc | +15-25% | 6-8 years |
| Solar + 4hr storage | 4 kWh/kWp | +$0.80-1.20/Wdc | +25-40% | 7-9 years |
| Solar + DC-coupled BESS | 3-6 kWh/kWp | +$0.70-1.00/Wdc | +30-50% | 6-8 years |
| Off-grid solar + storage | 8-12 kWh/kWp | +$2.00-3.20/Wdc | Eliminates grid cost entirely | 8-12 years |
Cost & savings data: BloombergNEF 2025, SEIA/Wood Mackenzie Q4 2025, industryresearch.biz commercial installation survey 2023-2025
The coupling architecture—DC-coupled vs. AC-coupled—also affects both upfront cost and operational flexibility. DC-coupled systems charge batteries directly from the PV array before inversion, achieving round-trip efficiencies of 90-95% and reducing inverter costs. AC-coupled systems add a separate battery inverter, enabling easier retrofit of existing solar installations but with slightly lower efficiency (85-90%).
5. Cost Analysis: What B2B Buyers Actually Pay in 2025-2026
Understanding the true cost of a solar energy solution requires looking beyond the headline $/W figure. Total cost of ownership includes hardware, soft costs, financing, O&M, and eventual component replacement. Below is a transparent breakdown based on SEIA/Wood Mackenzie Q4 2025 benchmark data.
Commercial Solar Cost by System Size
| System Size | Cost per Watt (Wdc) | Total System Cost | Module Cost Share | Soft Cost Share | Typical Application |
|---|---|---|---|---|---|
| 50 kW | $1.60-$2.55 | $80,000-$127,500 | ~17% | ~45% | Small retail, office buildings |
| 100 kW | $1.50-$2.00 | $150,000-$200,000 | ~18% | ~42% | Mid-size commercial, warehouses |
| 500 kW | $1.40-$1.75 | $700,000-$875,000 | ~19% | ~38% | Large C&I, manufacturing |
| 1 MW | $1.30-$1.60 | $1,300,000-$1,600,000 | ~21% | ~35% | Industrial, distribution centers |
| 5 MW+ | $1.10-$1.40 | $5,500,000-$7,000,000 | ~23% | ~30% | Utility-scale, solar farms |
Source: SEIA/Wood Mackenzie Q4 2025 Solar Market Insight, GreenLancer 2026 Commercial Cost Guide, Nuwatt Energy 2026. Module cost ~$0.30/Wdc (stabilized). Soft costs include labor, permitting, interconnection, customer acquisition, and financing.
25-Year Total Cost of Ownership vs. Grid Power
| Cost Component | Solar (500 kW, on-grid) | Solar + Storage (500 kW + 1 MWh) | Grid Power (equivalent) |
|---|---|---|---|
| Initial CAPEX | $700,000-$875,000 | $1,100,000-$1,400,000 | $0 |
| ITC (30% federal) | -$210,000 to -$262,500 | -$330,000 to -$420,000 | $0 |
| Net CAPEX after ITC | $490,000-$612,500 | $770,000-$980,000 | $0 |
| Annual O&M (yr 1-10) | $3,500-$5,000 | $5,000-$8,000 | $0 |
| Inverter replacement (yr 12-15) | $25,000-$40,000 | $35,000-$55,000 | $0 |
| Battery replacement (yr 12-15) | $0 | $80,000-$150,000 | $0 |
| 25-year grid electricity cost | $1,200,000-$1,800,000 | $1,200,000-$1,800,000 | $1,200,000-$1,800,000 |
| 25-year net cost | $718,500-$902,500 | $1,070,000-$1,413,000 | $1,200,000-$1,800,000 |
| 25-year savings vs. grid | $481,500-$897,500 | $130,000-$387,000 | Baseline |
Assumptions: Electricity rate $0.12/kWh escalating 3% annually, capacity factor 18%, demand charge $15/kW. ITC at 30% base. Battery replacement at year 13 at projected 50% of current cost.
Note: All pricing is indicative market reference based on third-party reports. Final project costs vary by specification, location, and volume. Contact our team for a customized quote.
6. How to Evaluate Solar Energy Solution Providers
Selecting the right provider is the single most impactful decision in the solar procurement process. A poorly qualified EPC can turn a financially attractive project into a cost overrun nightmare. Use the following checklist to systematically evaluate potential partners.
Solar Provider Evaluation Checklist (10-Point Framework)
Global EPC Landscape: Who’s Building the Biggest Projects?
| Rank | Company | HQ | Installed Capacity | Notable Projects |
|---|---|---|---|---|
| 1 | China Energy Engineering Group | Beijing, China | 51.42 GW (wind + solar) | Uzbekistan 1 GW PV project (2025) |
| 2 | SOLV Energy | San Diego, USA | 20 GW | Oregon 1.6 GW solar; Texas 1.2 GW |
| 3 | Sterling & Wilson | Mumbai, India | 19.4 GW | Abu Dhabi Sweihan 1,177 MWp (largest single-site) |
| 4 | Mortenson Solar | Minneapolis, USA | 12+ GW | Texas Solar Nova 452 MW; Edwards + Sanborn solar+storage |
| 5 | McCarthy Renewable Energy | St. Louis, USA | 9.5 GW | Tilden 182 MW (former coal mine); Lupinus 620+ MW + storage |
| 6 | PowerChina | Beijing, China | 8.11 GW | Saudi Arabia Round 5 MAS 1,250 MW + AHK2 500 MW |
| 7 | First Solar (EPC Services) | Tempe, USA | Undisclosed | Topaz Solar Farm (one of world’s largest grid-connected PV) |
| 8 | Risen Energy | Ningbo, China | Undisclosed | Integrated module manufacturing + EPC + O&M |
| 9 | Equans (Bouygues Group) | Paris, France | 5.5 GW + 550 MWh BESS | Global EPC + BESS integration across Europe |
| 10 | Eiffage Energie Systemes | Paris, France | 1,102 MW | Portugal Amareleja PV; projects in Spain, Mexico, Chile, Jamaica |
Source: Blackridge Research & Consulting, Solar Power World Top Solar EPCs 2025, Wiki-Solar (2025-2026)
7. The B2B Solar Procurement Roadmap: From RFQ to Commissioning
A structured procurement process is the difference between a project that delivers its modeled ROI and one that bleeds money through delays, change orders, and underperformance. Below is a 7-step roadmap that leading energy procurement teams follow.
Step 1: Energy Audit & Needs Assessment (Weeks 1-4)
Conduct a comprehensive energy audit covering 12-24 months of consumption data (kWh, kW demand, load profile by hour). Identify peak demand periods, TOU rate exposure, and available roof/ground area. Define project objectives: cost reduction percentage, resilience requirements, carbon targets, and budget constraints. Deliverable: Energy audit report with recommended system size, architecture, and financial model.
Step 2: RFQ & Vendor Selection (Weeks 5-12)
Issue a detailed Request for Quotation to 4-6 pre-qualified EPC firms. RFQ must specify: system size range, preferred architecture (on-grid/hybrid), component preferences (Tier 1 modules, bankable inverters), warranty requirements, performance guarantee terms, and commissioning deadline. Evaluate responses using the 10-point provider checklist. Deliverable: Shortlist of 2-3 finalists with detailed technical proposals and firm pricing.
Step 3: Engineering & Design (Weeks 13-24)
Selected EPC conducts site survey, structural analysis (roof load capacity or soil testing for ground-mount), shade analysis, and electrical single-line diagram development. Design must address grid interconnection requirements, permitting constraints, and code compliance (NEC/IEC). For storage projects, battery sizing optimization is performed using load profile data. Deliverable: stamped engineering drawings, energy production model (PVsyst), and construction schedule.
Step 4: Financing & Contracting (Weeks 13-20, parallel with Step 3)
Finalize financing structure: direct purchase, solar loan, PPA, or lease. Secure ITC eligibility documentation. Execute EPC contract (lump-sum turnkey preferred), performance guarantee agreement, and O&M service agreement. For PPAs, negotiate electricity price escalation rate (typically 1-3% annually) and term length (15-25 years). Deliverable: Signed contracts with all financing, construction, and service terms.
Step 5: Permitting & Interconnection (Weeks 17-40)
Submit building permits, electrical permits, and utility interconnection applications. Timeline varies dramatically by jurisdiction: 4-8 weeks in streamlined markets, 6-12 months in complex jurisdictions. Utility studies may require transformer upgrades or grid reinforcement. Apply for all available incentives (ITC, state rebates, SREC programs). Deliverable: All permits approved, interconnection agreement signed, incentive applications submitted.
Step 6: Construction & Installation (Weeks 25-40)
EPC mobilizes construction team. Typical sequence: site preparation → mounting installation → module placement → DC wiring → inverter installation → AC wiring → battery system integration (if applicable) → SCADA/commissioning system setup. Construction duration: 2-4 weeks (100 kW), 6-10 weeks (500 kW), 12-16 weeks (1+ MW). Weekly progress meetings and milestone-based payments. Deliverable: Fully installed and pre-commissioned system ready for testing.
Step 7: Commissioning & Handover (Weeks 38-44)
Perform acceptance testing: insulation resistance, grounding continuity, inverter functional test, grid synchronization, performance ratio (PR) measurement over 3-7 days. Verify SCADA monitoring is operational and reporting correctly. Transfer O&M documentation, as-built drawings, warranty certificates, and spare parts list. Conduct owner training on monitoring platform and basic troubleshooting. Deliverable: Commissioning certificate, performance guarantee activation, and system handover.
8. Regional Market Opportunities: Where Solar Energy Solutions Are Booming
Based on our search term analysis and global market data, the following six regions represent the highest-growth opportunities for B2B solar energy solutions procurement in 2025-2026.
| Region | Market Size (2025-2026) | Growth Driver | Avg. Commercial $/W | Key Policy/Incentive |
|---|---|---|---|---|
| UAE / Dubai | $4.8B (2026) → $12.99B (2035) | Masdar mega-projects, Net Zero 2050 | $1.20-1.60 | Dubai Clean Energy Strategy 2050 |
| Saudi Arabia | $3.2B → $8.5B (2030) | Vision 2030, NEOM, 58.7 GW renewable target | $1.10-1.50 | National Renewable Energy Program (NREP) |
| Kenya / East Africa | $0.8B → $2.5B (2030) | Off-grid telecom, rural electrification | $1.80-2.80 | Kenya Energy Act 2019, net metering |
| Southeast Asia | $12.5B → $28B (2030) | Manufacturing reshoring, ASEAN solar targets | $1.30-1.70 | Vietnam FiT, Indonesia PLN tender program |
| European Union | $85B → $180B (2030) | REPowerEU, EU Solar Energy Strategy | $1.50-2.00 | EU Solar Rooftops Standard (mandatory 2027) |
| United States | $48B → $95B (2030) | IRA tax credits, corporate PPA market | $1.40-1.80 | ITC 30% (up to 70% with adders), IRA |
Sources: Mordor Intelligence UAE Solar Energy Market 2026, MarkWide Research, 6Wresearch, Emergen Research, SEIA Solar Market Insight 2025
9. Future Trends: What’s Next for Solar Energy Solutions (2025-2030)
Five trends will reshape the solar energy solutions landscape over the next five years:
Technology Trends
- Perovskite-silicon tandem cells: Commercial production beginning in 2026-2027, promising 30%+ module efficiency (vs. current 22-24% for mono-PERC). This could reduce $/W by an additional 15-20% by 2030.
- AI-driven O&M: Machine learning models for predictive maintenance, soiling detection, and automated dispatch optimization are becoming standard features in monitoring platforms, reducing O&M costs by 20-30%.
- Vehicle-to-Grid (V2G) integration: EV fleets as distributed storage resources, enabling bi-directional charging that turns corporate parking lots into virtual power plants.
- Virtual Power Plants (VPPs): Aggregation of distributed solar+storage assets to participate in wholesale energy markets, creating new revenue streams for C&I system owners.
Market & Policy Trends
- ITC timeline pressure: The current 30% federal Investment Tax Credit faces step-down risk. Projects beginning construction before July 2026 secure the most favorable terms. B2B buyers should accelerate procurement timelines accordingly.
- Mandatory solar roofing: The EU Solar Rooftops Standard will require solar on all new commercial and public buildings from 2027, creating a massive compliance-driven market.
- Corporate PPA expansion: Global corporate solar PPA volumes exceeded 45 GW in 2025, with technology companies, manufacturers, and retailers leading procurement.
- Battery cost trajectory: BloombergNEF projects lithium-ion cell costs to reach $60-75/kWh by 2035, making 4-hour storage economically compelling for all commercial solar projects.
Financing Evolution
- Green bonds & sustainability-linked loans: Increasingly available at favorable rates for solar projects with verified carbon reduction outcomes.
- ITC transferability: The Inflation Reduction Act’s transferability provision (Section 6418) allows taxable entities to sell ITC credits, creating a secondary market that benefits non-profits and municipal buyers.
- C-PACE expansion: Commercial Property Assessed Clean Energy financing now available in 38+ US states, offering 20-30 year terms with no upfront cost.
10. Conclusion: Building Your Solar Energy Solutions Strategy
The solar energy solutions market has matured far beyond the early days of panel-only procurement. Today’s B2B buyer must navigate a five-layer ecosystem—generation, storage, services, financing, and digital—while managing a 7-step procurement process that spans 6-18 months. The payoff is substantial: 25-year savings of $500,000-$900,000 for a typical 500 kW commercial system, carbon reduction of 8,000+ tons over the system lifetime, and energy cost predictability that shields operations from utility rate volatility.
The key takeaways for procurement decision-makers:
- Storage is no longer optional: With 63% of new commercial installs including batteries and cell costs at $117/kWh, plan for hybrid from day one—even if storage is phased in later.
- Soft costs are the new battleground: Module prices have stabilized at $0.30/Wdc; the biggest cost reduction opportunity now lies in streamlining permitting, interconnection, and labor.
- EPC selection drives 80% of project outcomes: Use the 10-point evaluation checklist rigorously. The cheapest EPC is rarely the least-cost option over 25 years.
- Act on ITC timeline: Current tax incentives represent 30-70% of project cost. Construction start deadlines are approaching—delay is the most expensive option.
- Monitor continuously: A SCADA platform with automated fault detection can recover 5-10% of lost annual production—often the difference between meeting or missing your ROI target.
Frequently Asked Questions
What are solar energy solutions?
Solar energy solutions encompass the full ecosystem of products, services, and business models that enable organizations to generate, store, manage, and monetize solar power. This includes solar PV generation systems, battery energy storage, EPC (Engineering, Procurement, Construction) services, operations and maintenance, and financing structures like PPAs and leasing.
How much do commercial solar energy solutions cost in 2025-2026?
Commercial solar energy solutions cost $1.40 to $1.80 per watt DC installed in 2025-2026, according to SEIA and Wood Mackenzie. A 100 kW system costs approximately $140,000 to $180,000, while a 1 MW system ranges from $1.4 million to $1.8 million. Solar module prices have stabilized at approximately $0.30/Wdc, but soft costs including labor, permitting, and interconnection continue to rise.
What is the difference between on-grid, off-grid, and hybrid solar solutions?
On-grid solar systems connect directly to the utility grid and rely on it for backup power. Off-grid systems operate independently with battery storage for full energy autonomy. Hybrid systems combine grid connection with battery storage, offering both grid backup and energy arbitrage capabilities. As of 2025, over 63% of commercial solar installations include storage, making hybrid the fastest-growing architecture.
How long does it take to implement a commercial solar energy solution?
A typical commercial solar project follows a 7-step procurement roadmap: needs assessment (2-4 weeks), RFQ and vendor selection (4-8 weeks), engineering and design (4-12 weeks), financing and contracting (4-8 weeks), permitting and interconnection (8-24 weeks), construction and installation (4-16 weeks), and commissioning (2-4 weeks). The total timeline ranges from 6 to 18 months depending on system size and jurisdiction.
What is a solar EPC contract and how does it work?
A solar EPC (Engineering, Procurement, and Construction) contract is a turnkey agreement where a single contractor handles the entire project lifecycle from design through commissioning. The global solar EPC market was valued at $259.58 billion in 2026 and is projected to reach $317.6 billion by 2030. EPC contracts transfer performance risk to the contractor and typically include warranty guarantees for energy output.
What is the ROI and payback period for commercial solar energy solutions?
Commercial solar energy solutions typically achieve a payback period of 5 to 8 years, with 25-year ROI of 200% to 400%. Key factors include the federal Investment Tax Credit (30% base, up to 70% with adders), accelerated depreciation (MACRS 5-year plus 100% bonus depreciation), electricity rate escalation, and demand charge reduction. Systems with battery storage can achieve additional savings through peak shaving and time-of-use arbitrage.
How do I choose the right solar energy solutions provider?
Evaluate providers using a 10-point checklist: track record and installed capacity, technical certifications (IEC, UL, NEC compliance), financial stability, EPC experience in your market segment, warranty and performance guarantee terms, O&M service capability, component quality and bankability, references from similar projects, insurance and bonding, and post-installation monitoring platforms.
Is solar-plus-storage becoming the standard for B2B solar projects?
Yes. Between 2023 and 2025, over 63.2% of commercial solar installations included solar-plus-storage systems. Battery costs have declined by over 80% since 2010, with lithium-ion battery cell prices reaching approximately $117/kWh in 2025. Storage integration enables peak demand reduction, time-of-use arbitrage, grid backup, and participation in ancillary services markets, making it economically compelling for most commercial and industrial applications.
Ready to Procure Your Solar Energy Solution?
Whether you need a commercial rooftop system, containerized solar-plus-storage, or a turnkey EPC solution, Huijue Group delivers bankable solar energy solutions for industrial and commercial applications worldwide.
Contact our solar engineering team | Explore our product range