
 chinahuijue@gmail.com
 +1 (702) 204-9855
Commercial & Industrial Energy Storage: Real Market Demand Analysis 2025-2026
| Question | Answer |
|---|---|
| Does C&I energy storage have real market demand? | Yes — market reached $91.99B in 2025, projected $183.99B by 2031 (CAGR 11.99%) |
| Primary demand driver | System costs fell 31% to $117/kWh (global avg); C&I-specific costs down 40% to $180-300/kWh |
| Typical payback period | 2-5 years (US high demand charge zones); 3-6 years (multi-stream revenue with subsidies) |
| Unlevered IRR range | 11-18% (with revenue stacking and incentives) |
| Top demand segments | Peak shaving (22.1%), commercial buildings (31.6%), EV fast charging (CAGR 28.2%) |
| Largest regional market | North America (36.5% global share); Asia-Pacific fastest-growing (CAGR 23.3%) |
| Global BESS shipments 2025 | 421.16 GWh (+75.48% YoY); 2026 forecast: 600 GWh |
Commercial and industrial (C&I) energy storage has moved from a promising concept to a rapidly scaling market reality. With global BESS shipments hitting 421 GWh in 2025 — a 75% year-over-year surge — and system prices dropping to historic lows, the question is no longer whether demand exists, but how fast it can scale. This guide examines the four pillars driving C&I energy storage demand: plunging costs, market rationalization, integrator maturity, and expanding investment geographies. For businesses evaluating energy storage solutions, understanding these dynamics is essential for making informed investment decisions.
1. What Is Commercial & Industrial Energy Storage?
C&I energy storage refers to battery energy storage systems (BESS) deployed at commercial and industrial facilities — typically ranging from 100 kWh to several MWh in capacity. Unlike utility-scale storage, which serves grid-level functions, C&I systems are installed behind-the-meter at manufacturing plants, retail centers, data centers, hospitals, and logistics hubs.
System Scale Classification
| Category | Capacity Range | Typical Application | Installed Cost ($/kWh) |
|---|---|---|---|
| Small C&I | 50-500 kWh | Small retail, offices, backup power | $500-1,000 |
| Medium C&I | 500 kWh – 2 MWh | Manufacturing, hotels, schools | $300-500 |
| Large C&I | 2-10 MWh | Industrial parks, data centers | $250-350 |
| Microgrid-scale | 10+ MWh | Industrial complexes, campuses | $200-300 |
C&I vs. Other Storage Segments (2025)
| Segment | 2025 Shipments (GWh) | YoY Growth | Key Characteristic |
|---|---|---|---|
| Utility-scale (大储) | 375.25 | +77.84% | Largest segment, grid services |
| Residential (户储) | 35.11 | +75.55% | Home energy independence |
| C&I (工商业) | ~10.8* | ~60%* | Behind-the-meter, demand charge driven |
| Total Global | 421.16 | +75.48% | — |
*C&I figure derived as residual; InfoLink does not separately report C&I shipments. Estimated based on total minus utility + residential.
2. Price Decline: The Primary Demand Driver
The most powerful force behind C&I energy storage demand is the dramatic and sustained decline in system costs. BloombergNEF’s 2025 Energy Storage System Cost Survey documents that the global average turnkey BESS price fell to $117/kWh — a 31% drop from 2024’s revised figure of $169/kWh. This is not a temporary dip; it reflects structural shifts in battery manufacturing, supply chain maturation, and economies of scale.
Global BESS System Price Evolution
| Year | Global Avg ($/kWh) | YoY Change | Key Driver |
|---|---|---|---|
| 2020 | $297 | — | Early commercial phase |
| 2022 | $215 | -27.6% | Scaling production, LFP adoption |
| 2023 | $185 | -14.0% | Supply chain normalization |
| 2024 | $169 | -8.6% | Overcapacity in China |
| 2025 | $117 | -30.8% | LFP cell price <$70/kWh; system integration gains |
| 2035 (Forecast) | $41-108* | — | Technology maturity, sodium-ion scale |
*2035 forecast: China $41/kWh, Europe $101/kWh, US $108/kWh (BNEF). Regional gaps persist due to tariffs, standards, and localization requirements.
Regional Cost Comparison (2025 Turnkey System)
| Region | System Cost ($/kWh) | vs. Global Avg | Key Factor |
|---|---|---|---|
| China | $73 | -37.6% | Manufacturing hub, overcapacity, domestic supply chain |
| Global Average | $117 | — | — |
| Europe | $177 | +51.3% | Higher soft costs, compliance, labor |
| United States | $219 | +87.2% | Tariffs, FEOC rules, permitting complexity |
What this means for C&I buyers: A 1 MW/2 MWh system that cost $600,000+ in 2023 can now be installed for approximately $350,000-450,000 in competitive markets — bringing demand-charge payback within 2-5 years in high-tariff regions.
Cost Breakdown: Where the Savings Come From
| Component | Cost Share | 2025 Price Trend | Outlook |
|---|---|---|---|
| Battery cells (LFP) | 35-40% | $70/kWh (cell-level) | Sodium-ion competition by 2027 |
| PCS (inverter) | 10-15% | Declining with scale | ABB/Gamesa merger reducing costs |
| BMS & EMS | 5-8% | Software-driven value | AI optimization adding premium |
| Enclosure & thermal | 10-12% | Liquid-cooled standardization | Cost stable, performance improving |
| EPC & installation | 20-30% | Regional variation | Soft costs dominate in US/EU |
| Grid connection | 5-15% | $30-100/kWh range | Regulatory bottleneck |
The virtuous cycle described in market analysis is real: lower prices drive adoption, adoption drives scale, scale drives further cost reduction, and falling costs attract additional investment capital. China’s manufacturing dominance — supplying over half of global commercial BESS shipments at costs 20-30% below Western markets — ensures this deflationary trend will continue.
3. Market Rationalization: From Hype to Strategic Investment
The C&I energy storage market has passed through the classic technology adoption cycle’s “trough of disillusionment” and emerged more mature. In the early stage (2021-2023), overoptimism drove trend-following investments, creating market confusion. By 2025-2026, market participants have become notably more rational, focusing on long-term feasibility rather than short-term speculation.
Market Maturity Indicators
| Indicator | 2021-2023 (Hype Phase) | 2025-2026 (Rational Phase) |
|---|---|---|
| Investment focus | Short-term ROI, speculation | Long-term feasibility, system performance |
| Due diligence | Surface-level evaluation | Deep technical, financial, and risk analysis |
| Project selection | Trend-driven, FOMO | Data-driven, site-specific optimization |
| Revenue model | Single-stream (demand charge only) | Multi-stream stacking (demand + arbitrage + self-consumption + grid services) |
| Equipment evaluation | Price-first | Performance + reliability + TCO |
| Contract structure | Simple EPC | Performance guarantees, O&M agreements, hybrid PPAs |
How Rational Investment Changes the Market
Rational market behavior produces three critical improvements:
| Improvement Area | Mechanism | Market Impact |
|---|---|---|
| Reduced volatility | Investors avoid herd behavior, smoothing deployment curves | Predictable demand growth benefits supply chain planning |
| Resource efficiency | Capital flows to viable projects, not speculative ones | Lower project failure rates; better asset utilization |
| Technology quality | Buyers demand performance data, warranties, certifications | Drives integrators to invest in R&D and quality control |
| Revenue sophistication | Multi-stream models replace single-revenue bets | IRR improvements of 2-4 percentage points from revenue stacking |
Key insight: The shift from single-stream to multi-stream revenue models has been transformative. A C&I project relying solely on demand charge reduction in Europe might have a 7+ year payback — unconvincing for corporate boards. But combining demand charges, energy arbitrage, solar self-consumption, and grid service participation compresses payback to 3-6 years with unlevered IRR of 11-18%.
4. Integrator Readiness: Technology & Service Evolution
Energy storage integrators have invested heavily in technology, manufacturing capacity, and service capabilities — positioning themselves to meet accelerating market demand. The global BESS integrator landscape shipped 421 GWh in 2025, with the top 10 companies controlling approximately 45% of global capacity.
Top 10 Global BESS Integrators (2025)
| Rank | Company | Market Share | 2025 Shipment | Country | Key Strength |
|---|---|---|---|---|---|
| 1 | BYD | 13% | ~60 GWh | China | Vertical integration (cell → system) |
| 2 | Tesla | 10% | ~46.7 GWh | USA | Megapack scale, global brand |
| 3 | Sungrow | 9% | ~43 GWh | China | PCS + storage synergy, 49% YoY revenue growth |
| 4 | CRRC Zhuzhou | 6% | — | China | Railway-grade reliability |
| 5 | CATL | 6% | — | China | Cell technology leader, sodium-ion pioneer |
| 6 | Hithium | 6% | — | China | Large-capacity cell specialization |
| 7 | Huawei | 5% | — | China | Smart string inverter + digital platform |
| 8 | Envision Energy | 5% | — | China | Net-zero ecosystem integration |
| 9 | Sunwoda | 4% | — | China | Consumer battery → BESS expansion |
| 10 | Fluence | 4% | — | USA | Mosaic platform, 12 GW managed assets |
Source: Benchmark Mineral Intelligence / EnergyTrend, May 2026. Eight of top ten are Chinese companies.
Technology Advancements by Integrators
| Innovation Area | Description | Market Impact |
|---|---|---|
| Large-format cells (300Ah+) | CATL, BYD, Hithium pushing 314Ah, 587Ah cells | DC system cost reduced 50% vs. small cells |
| Intelligent EMS platforms | Fluence Mosaic (12 GW managed), Huawei FusionSolar | Remote monitoring, AI-driven optimization, predictive maintenance |
| Liquid-cooled standardization | Sungrow, BYD, Tesla all-in on liquid cooling | Higher energy density, longer cycle life (6,000-8,000 cycles) |
| Integrated PV+Storage solutions | Sungrow (41.81% revenue from storage), Huawei | Single-vendor convenience, optimized PV-DC coupling |
| Sodium-ion commercialization | CATL 175 Wh/kg (Oct 2024), mass production 2026-2027 | Lower material cost, cold-climate performance |
| Second-life battery systems | 63 MWh Texas project (Sep 2024), 40-50% lower cost | Circular economy, reduces CAPEX for budget-sensitive C&I |
Service Evolution: Beyond Equipment Sales
| Service Layer | Traditional Model (Pre-2023) | Current Model (2025-2026) |
|---|---|---|
| Pre-sale | Product catalog, basic sizing | Site assessment, load profiling, financial modeling |
| Installation | Deliver & deploy | Turnkey EPC with performance guarantees |
| Operations | Manual monitoring, reactive maintenance | Cloud-based EMS, predictive analytics, automated dispatch |
| After-sales | Warranty replacements | Performance-based O&M contracts, revenue optimization services |
| Financing | Buyer arranges own financing | Equipment leasing, Energy-as-a-Service (EaaS), shared savings |
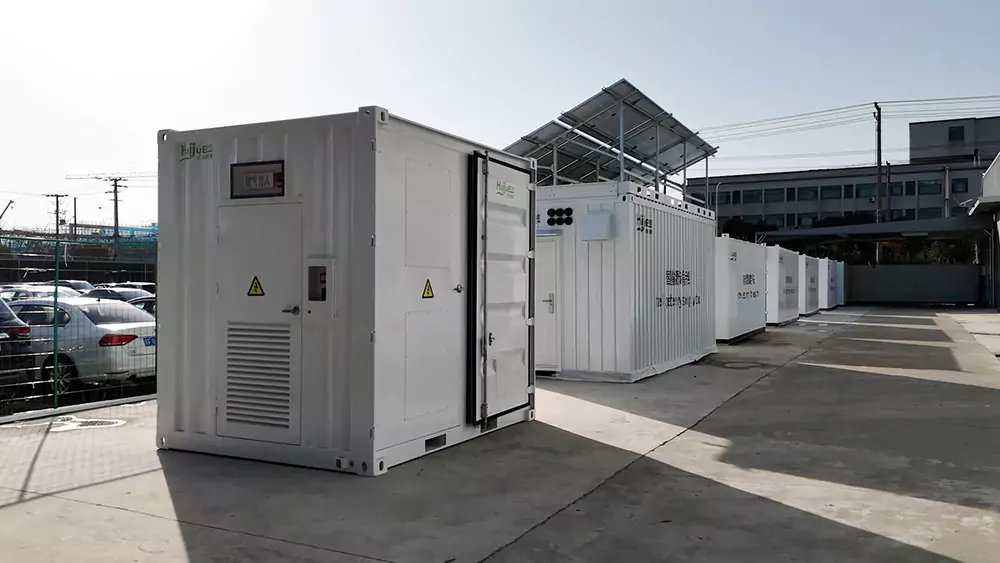
This service evolution is critical for market expansion. Many C&I customers lack in-house energy expertise — integrators who provide end-to-end solutions from feasibility study through long-term O&M remove the primary barrier to adoption. For businesses exploring containerized energy storage solutions, this means access to professional-grade systems without needing specialized internal teams.
5. Expanding Investment Regions: Policy & Market Geography
The geographic footprint of viable C&I energy storage investment has expanded dramatically. In 2025, at least 25 Chinese provinces and 40+ countries globally have enacted supportive policies — including subsidies, tax incentives, and tariff structures that make C&I storage economically viable.
Global C&I Energy Storage Market by Region (2025)
| Region | Market Share | Growth Rate (CAGR) | Key Policy Driver | Standout Market |
|---|---|---|---|---|
| North America | 36.5% | ~14% | IRA tax credit (30% ITC), SGIP subsidies | California ($200/kWh SGIP, 3+ GW deployed) |
| Asia-Pacific | ~30% | 23.3% | China New Energy Storage Action Plan 2025-2027 | China (lowest cost globally, 25+ provinces with policies) |
| Europe | ~22% | ~12% | REPowerEU (45% renewable by 2030), capacity markets | Germany (200+ negative pricing days/year) |
| Middle East & Africa | ~6% | ~18% | Saudi Vision 2030 (40 GW solar target) | Saudi Arabia (BYD 12.5 GWh project) |
| Latin America | ~3% | ~15% | Brazil net metering, Chile storage law | Chile (mandated storage for renewable projects) |
| Oceania | ~2.5% | ~16% | Australia C&I demand charge reform | Australia (high retail prices, strong solar) |
Policy Instruments Driving C&I Storage Investment
| Policy Type | Mechanism | Example Markets | Impact on C&I ROI |
|---|---|---|---|
| Direct subsidies | Per-kWh installation rebates | California SGIP ($200/kWh), Poland NFOŚiGW (€1B fund) | Reduces CAPEX by 20-40% |
| Tax credits | Investment Tax Credit (ITC) | US IRA (30% federal), India accelerated depreciation | Effectively reduces CAPEX by 30% |
| Peak-valley tariff spread | Widened price differential | China (25+ provinces), UK, Italy, Poland | Increases arbitrage revenue 50-200% |
| Demand charge structures | $/kW/month peak demand fees | US utilities ($15-25/kW/month), Australia | Primary revenue stream; $120k/yr for 1MW system |
| Capacity markets | Long-term capacity payments | UK (12-year agreements), Poland (KWD mechanism) | Stabilizes revenue floor for 10+ years |
| Mandates & targets | Storage procurement requirements | India (>500kW solar must include 2hr storage), Chile | Creates guaranteed demand baseline |
| Negative pricing penalties | Curtailment fines for excess solar | Germany (€100/MWh curtailment charge) | Forces storage adoption for solar-heavy sites |
Regional Spotlight: Where C&I Storage Makes Economic Sense
| Market | System Cost ($/kWh) | Primary Revenue | Payback (yrs) | IRR Range |
|---|---|---|---|---|
| California, USA | $219 | Demand charge + SGIP + arbitrage | 2-4 | 15-22% |
| Texas (ERCOT), USA | $219 | Arbitrage (summer peaks >$0.20/kWh) | 3-5 | 12-18% |
| Germany | $177 | Negative pricing avoidance + self-consumption | 4-6 | 10-15% |
| Poland | $177 | Capacity market + demand + arbitrage | 4-6 | 11-16% |
| China (Jiangsu/Zhejiang) | $73 | Peak-valley spread (0.7-1.0 RMB/kWh) | 3-5 | 12-20% |
| United Kingdom | $177 | Capacity market (12yr) + arbitrage | 4-6 | 10-14% |
| Saudi Arabia | $150* | Renewable firming + grid stability | 5-7 | 8-12% |
*Estimated based on regional import costs and local installation. Saudi market is emerging with large utility-scale projects driving down C&I equipment costs.
6. C&I Energy Storage Revenue Stack: Five Income Streams
The economic viability of C&I energy storage depends on stacking multiple revenue streams. The modern approach has evolved from single-stream (demand charge only) to sophisticated multi-stream optimization.
The Five-Stream Revenue Model
| Revenue Stream | Mechanism | Annual Value (1MW/2MWh system) | Reliability |
|---|---|---|---|
| 1. Demand charge reduction | Shave peak kW demand by 15-25% | ~$120,000 | High (predictable tariffs) |
| 2. Energy arbitrage | Charge at night, discharge during peak pricing | $15,000-45,000 | Medium (market-dependent) |
| 3. Solar self-consumption | Store excess PV, avoid retail purchase | $10,000-30,000 | High (if PV installed) |
| 4. Grid services / capacity | Frequency regulation, capacity market | $10,000-30,000 | Medium (contract-dependent) |
| 5. Resilience / backup | Avoid outage losses (cold storage, data center) | $5,000-50,000+ | Event-driven (high value per event) |
| Total Potential | Multi-stream stacking | $160,000-275,000 | — |
Demand Charge Impact by Facility Type
| Facility Type | Demand Charge (% of bill) | Peak Profile | Storage Fit |
|---|---|---|---|
| Cold storage warehouse | 60-70% | Sharp, predictable peaks | Excellent |
| Manufacturing plant | 40-60% | Production-cycle driven | Excellent |
| Data center | 30-50% | Flat, high baseload | Good (backup value high) |
| Retail / commercial | 25-40% | Daytime business hours | Good |
| Office building | 20-35% | Morning + afternoon peaks | Fair |
| Hospital | 30-50% | 24/7 critical load | Excellent (resilience) |
Revenue stacking is the key to bankability. Adding grid services or capacity market participation to a demand-charge project typically improves IRR by 2-4 percentage points. In Poland, for example, a factory project combining demand charges, arbitrage, solar self-consumption, and capacity market revenue — supported by NFOŚiGW subsidies — achieves unlevered IRR in the low-to-mid double digits with a 4-6 year simple payback.
7. Cost & ROI Analysis: When Does C&I Storage Pay Off?
Full CAPEX Breakdown by System Size
| System Size | Total CAPEX | Cost ($/kWh) | Annual Savings | Simple Payback | 10yr NPV* |
|---|---|---|---|---|---|
| 200 kWh | $100,000-200,000 | $500-1,000 | $15,000-30,000 | 5-7 yrs | $50k-100k |
| 500 kWh | $175,000-350,000 | $350-700 | $40,000-70,000 | 4-6 yrs | $150k-300k |
| 1 MWh | $300,000-450,000 | $300-450 | $80,000-140,000 | 3-5 yrs | $400k-700k |
| 2 MWh | $500,000-900,000 | $250-450 | $140,000-250,000 | 3-5 yrs | $700k-1.4M |
| 5 MWh | $1,000,000-1,750,000 | $200-350 | $300,000-550,000 | 2-4 yrs | $1.5M-3.0M |
*NPV calculated at 8% discount rate over 10 years, excluding residual value. Assumes multi-stream revenue model.
ROI Comparison: Single-Stream vs. Multi-Stream
| Metric | Demand Charge Only | Demand + Arbitrage | Full Multi-Stream |
|---|---|---|---|
| Annual revenue (1MW/2MWh) | $120,000 | $150,000-165,000 | $160,000-275,000 |
| Payback period | 5-7 years | 4-5 years | 3-6 years |
| Unlevered IRR | 8-12% | 10-14% | 11-18% |
| 10yr NPV (8% discount) | $200k-400k | $350k-550k | $400k-950k |
| Board approval likelihood | Low (marginal) | Medium | High (compelling) |
Regional ROI Snapshot: Where Storage Economics Work Best
| Market | CAPEX ($/kWh) | Revenue Stack Value | Payback | IRR | Verdict |
|---|---|---|---|---|---|
| California, USA | $219 | Demand ($25/kW) + SGIP + arbitrage | 2-4 yrs | 15-22% | Excellent |
| New York, USA | $219 | Demand ($20/kW) + VDER value stack | 3-5 yrs | 12-18% | Strong |
| Germany | $177 | Negative pricing + self-consumption | 4-6 yrs | 10-15% | Good |
| UK | $177 | Capacity (12yr) + arbitrage | 4-6 yrs | 10-14% | Good |
| China (coastal) | $73 | Peak-valley spread + demand | 3-5 yrs | 12-20% | Excellent |
| Australia | $200 | High retail price + demand | 4-6 yrs | 10-15% | Good |
| Poland | $177 | Capacity + demand + arbitrage + subsidy | 4-6 yrs | 11-16% | Good (with subsidy) |
8. Emerging Demand Drivers: What’s Accelerating Adoption
Beyond the traditional demand-charge and arbitrage economics, several emerging drivers are creating entirely new categories of C&I storage demand.
Emerging Demand Segments (2025-2026)
| Demand Driver | Growth Rate | Market Size Signal | Why Storage Is Essential |
|---|---|---|---|
| Data centers / AI compute | +17% electricity (2025) | Google: 300 MW/30 GWh project; fossil peak reduction 85% | Grid connection delays; SLA penalties exceed energy costs |
| EV fast charging stations | CAGR 28.2% (2026-2031) | Peak power fees >$20/kW in some cities | Avoid grid upgrade costs; manage demand spikes |
| EV fleet depots | CAGR 28.7% (2026-2031) | Fleet operators scaling electrification | Simultaneous charging creates massive peak demand |
| RE100 corporate commitments | 400+ companies | 380 TWh/year renewable demand | 24/7 carbon-free energy requires storage firming |
| Microgrid development | ~15% CAGR | Hospitals, military, industrial parks | Island-mode capability, grid independence |
| Industrial park electrification | ~12% CAGR | Urbanization + industrial policy | Grid capacity insufficient for new loads |
Data Center Energy Storage: The Breakthrough Segment
| Metric | Value | Source |
|---|---|---|
| Global DC electricity growth (2025) | +17% | IEA, 2025 |
| AI-focused DC growth rate | Higher than overall average | IEA, 2025 |
| Google Minnesota project | 300 MW / 30 GWh | Google, 2025 |
| Fossil peak dependency reduction | -85% | Google, 2025 |
| Tesla Megapack annual run-rate | 40+ GWh | Tesla, Q4 2025 |
| Tesla UK project revenue | $40M+/year (500 MW/1 GWh) | Tesla, Jan 2026 |
| DC outage cost (per event) | $50,000-500,000+ | Industry estimates |
Strategic implication: Data centers represent the highest-value C&I storage segment because: (1) grid interconnection queues can delay new connections by 3-7 years, (2) SLA penalties for outages can exceed energy costs by 10x, and (3) major tech companies have explicit renewable energy commitments requiring storage. This segment alone could drive 50+ GWh of annual C&I storage demand by 2027.
Technology Trends Enabling New Applications
| Technology | Status (2025) | Impact on C&I Demand | Timeline |
|---|---|---|---|
| LFP (lithium iron phosphate) | 80.4% market share; 6,000+ cycles | Dominant chemistry; proven safety for indoor use | Mature |
| Sodium-ion | CATL 175 Wh/kg; mass production starting | 20-30% lower material cost; cold-climate advantage | 2026-2028 commercial scale |
| Second-life EV batteries | 63 MWh deployed (Texas, 2024) | 40-50% CAPEX reduction for budget-sensitive buyers | Growing; standardization needed |
| AI-driven EMS | Fluence Mosaic (12 GW), Huawei FusionSolar | +2-4% IRR from optimized dispatch | Deployed, scaling |
| Virtual power plants (VPP) | Aggregating C&I systems for grid services | Additional revenue stream; unlock capacity market | Regulatory-dependent |
9. Market Outlook, Risks & Strategic Recommendations
C&I Energy Storage Market Forecast (2025-2031)
| Year | Market Size ($B) | YoY Growth | Key Milestone |
|---|---|---|---|
| 2025 | $91.99 | — | LFP system costs break $120/kWh barrier |
| 2026 | $104.45 | +13.5% | Global BESS shipments reach 600 GWh |
| 2027 | $117.0* | +12.0% | Sodium-ion reaches commercial scale |
| 2028 | $131.0* | +12.0% | EV fleet storage becomes major segment |
| 2029 | $146.5* | +11.8% | Data center storage demand accelerates |
| 2030 | $163.5* | +11.6% | RE100 deadline drives 24/7 clean energy |
| 2031 | $183.99 | +12.5% | C&I storage mainstream in industrial parks |
*Forecast based on CAGR of 11.99% (Mordor Intelligence). Market size includes all C&I BESS applications globally.
Risk Matrix: Factors That Could Slow Growth
| Risk Factor | CAGR Impact | Time Horizon | Mitigation Strategy |
|---|---|---|---|
| High CAPEX vs. diesel generators | -1.80% | Short (≤2 years) | Multi-stream revenue stacking; EaaS financing |
| Critical mineral supply volatility | -1.50% | Medium (2-4 years) | Sodium-ion diversification; second-life batteries |
| Fragmented interconnection rules | -0.90% | Medium (2-4 years) | Policy advocacy; standardized permitting |
| Indoor BESS fire compliance | -0.70% | Short (≤2 years) | UL 9540A certification; outdoor containerized solutions |
| Policy reversal / subsidy cuts | -0.50% | Medium (2-4 years) | Diversify across regions; don’t rely on single subsidy |
| Grid code changes reducing revenue | -0.40% | Medium (2-4 years) | Flexible dispatch algorithms; multi-market participation |
Strategic Recommendations by Stakeholder
| Stakeholder | Recommendation | Priority | Timeline |
|---|---|---|---|
| C&I facility owners | Conduct load profile analysis; identify demand charge savings potential; evaluate multi-stream revenue models before committing | High | Now — costs are at historic lows |
| Investors | Focus on projects with stacked revenue models; verify integrator track record; assess policy stability in target region | High | 2025-2027 window before costs stabilize |
| Integrators | Invest in EMS/AI capabilities; develop service-based revenue models; pursue certifications (UL 9540A, IEC 62619) | Critical | Ongoing |
| Policymakers | Standardize interconnection; maintain stable subsidy frameworks; expand peak-valley tariff spreads | High | 2025-2026 |
| Technology providers | Accelerate sodium-ion commercialization; develop VPP aggregation platforms; improve cycle life beyond 8,000 | Medium | 2026-2028 |
Bottom line: The C&I energy storage market has real, quantifiable demand driven by four converging forces: (1) system costs down 31% to $117/kWh, (2) rational market participation replacing speculative investment, (3) integrator technology and service maturity enabling turnkey deployment, and (4) expanding investment geographies with supportive policies in 40+ countries. The market is projected to double from $92B to $184B by 2031 — but success requires multi-stream revenue models, careful regional selection, and partnership with proven integrators.
Frequently Asked Questions
Does commercial and industrial energy storage have real market demand in 2025?
Yes. The global C&I energy storage market reached $91.99 billion in 2025 and is projected to grow at a CAGR of 11.99% through 2031. Key demand drivers include 40% cost declines to $180-300/kWh, expanding peak-valley tariff spreads, data center power needs growing 17% annually, and over 400 RE100 companies requiring 100% renewable electricity.
How much does a C&I energy storage system cost in 2025?
In 2025, the global average turnkey BESS cost is $117/kWh, down 31% year-over-year. For C&I-specific systems, costs range from $180-300/kWh. Regional variation is significant: China at $73/kWh, Europe at $177/kWh, and the US at $219/kWh. Large systems above 1 MWh cost $250-450/kWh fully installed, while smaller 50-500 kWh systems cost $500-1,000/kWh due to higher soft-cost ratios.
What is the payback period for C&I energy storage?
Payback periods range from 2-5 years in US markets with high demand charges above $15/kW/month, to 3-6 years for multi-stream revenue projects combining demand charges, arbitrage, solar self-consumption, and grid services. Unlevered IRR typically ranges from 11-18% when incentives and revenue stacking are included.
Which companies are the top C&I energy storage integrators?
The top 10 global energy storage system integrators in 2025 are BYD (13% market share), Tesla (10%), Sungrow (9%), CRRC Zhuzhou Institute (6%), CATL (6%), Hithium (6%), Huawei (5%), Envision Energy (5%), Sunwoda (4%), and Fluence (4%). Eight of the top ten are Chinese companies, reflecting China’s dominance in BESS manufacturing with costs 20-30% lower than Western markets.
What are the main revenue streams for C&I energy storage?
C&I energy storage generates revenue through five streams: demand charge reduction (30-70% of electricity bills), energy arbitrage (peak-valley price spread), solar self-consumption optimization, grid services and capacity market participation (adding 2-4 percentage points to IRR), and resilience/backup power value. A 1 MW/2 MWh system can save approximately $120,000 annually through demand management alone.
Which regions offer the best C&I energy storage investment opportunities?
North America leads with 36.5% global market share, driven by California’s SGIP subsidy up to $200/kWh and high demand charges. Asia-Pacific is the fastest-growing region at 23.3% CAGR. Europe offers strong opportunities in Germany (200+ negative pricing days/year) and the UK (12-year capacity market agreements). China has the lowest system costs at $73/kWh but is exclusively served by domestic players.
How are data centers driving C&I energy storage demand?
Global data center electricity demand surged 17% in 2025, with AI-focused data centers growing even faster. Major tech companies like Google are investing in BESS projects (e.g., 300 MW/30 GWh in Minnesota) to reduce fossil peak dependency by 85%. Grid connection delays for data centers are pushing operators toward on-site storage, making BESS a critical infrastructure component.
What risks should investors consider in C&I energy storage?
Key risks include high CAPEX versus diesel generators (-1.80% CAGR impact), critical mineral supply chain volatility (lithium carbonate prices ranged $12,000-38,000/ton in 2024-2025), fragmented interconnection and permitting rules (-0.90% CAGR impact), and indoor BESS fire compliance costs (-0.70% CAGR impact). Investors should evaluate technology solutions, business models, and regional policy stability before committing capital.
Ready to Evaluate C&I Energy Storage for Your Facility?
Huijue Group provides commercial and industrial energy storage solutions tailored to your load profile, tariff structure, and ROI targets. From 100 kWh to 10+ MWh systems, our engineering team delivers turnkey BESS projects with performance guarantees and long-term O&M support.
Sources: BloombergNEF Energy Storage System Cost Survey 2025; Mordor Intelligence C&I Energy Storage Market Report 2026; InfoLink Global BESS Integrator Shipments Ranking 2025; Benchmark Mineral Intelligence; Ember “How Cheap Is Battery Storage?” Dec 2025; IEA Data Centre Electricity Report 2025; howtostoreelectricity.com C&I Revenue Stack Analysis Oct 2025.